In the last decade, we have seen an increased concern with the quality of the environment, especially due to air, water, and noise pollution. Any displeasing sound that is created by humans, animals, and machines is the cause of Noise Pollution. Continuous exposure to noise above a threshold can cause severe ear pain or even permanent hearing loss in humans as well as animals. But what noise levels are safe? In this guide, let us understand the basics of Noise. We will also see how to measure noise. After that, we will take a look at a Noise Level Decibels Chart with the noise made by everyday objects.
A Brief Note on Sound
Before understanding Noise, we need to first know a little bit about Sound. After all, Noise is nothing but unwanted Sound. The ‘Sound’ we hear is the result of pressure variation in the air or any medium.
When a source induces vibrations in the air, it is actually producing an alternating band of dense and sparse particles of air. The movement of air particles will result in a fluctuation of atmospheric pressure.
Our ear detects these pressure fluctuations happening above and below the atmospheric pressure and creates the sensation of hearing.
Sound is a form of energy produced by longitudinal mechanical waves in solids, liquids, or gases. We need a source or vibrating object to transmit sound waves. These sound waves travel through a medium. Finally, we need a receiver, an ear in our case, to absorb the energy.
What is Noise?
As we already mentioned before, any unwanted sound is Noise. Here, the term ‘unwanted’ means that it has adverse health effects on human and animal hearing.
We can also define Noise as a sound that interferes with speech and hearing. In terms of public health concerns, noise is a sound that has enough intensity to cause hearing damage
The meaning of noise can be subjective. One person may enjoy listening to heavy metal music at one volume. But the same music at the same volume may be noise to another person.
There are many sources of Noise. Household works and chores, transportation, and construction are some noises everyone encounters frequently. If you live near or work in an industrial area, then there are several sources of noise there. Machines, motors, tools, etc. all create noise.
Effects of Noise
On Human Health
Noise Pollution is the latest category of environmental pollutants (the other being air and water). Several institutions and organizations have formally recognized noise as a threat to the health and well-being of humans. Hearing loss is the first and most important effect of noise.
Apart from physiological health, noise also affects the psychological behavior of humans. Continuous exposure to severe levels of noise can cause hypertension, stress, irregular sleep patterns, etc.
On Environment
Noise also has a harmful effect on animal life. Overexposure to noise can lead to temporary or permanent hearing loss in many animals. Noise can also cause stress and disturbs the balance of predator – prey detection.
An impact of noise on animals is an increased risk of untimely death. You might have seen the news about the death of whales due to exposure to military sonar.
How Do We Measure Noise?
Before looking at the Noise Level Decibels Chart, we need to first understand how we measure Sound or Noise.
We know that a vibrating source alternately rises and drops the pressure of air particles with respect to atmospheric pressure. This variation in the pressure of the medium (air) above and below the atmospheric pressure is known as Sound Pressure.
The SI units of pressure are pascals (Pa) or Newton per meter square (N/m2). The human ear can detect sound pressures in the range of 20µPa all the way over 200Pa.
Two important points to note here. The range of sound pressure that can be produced is huge from 0.00002Pa to 1000Pa. The second point is the response of the human ear to an increase in sound pressure is not linear.
Hence, we measure sound using the decibel scale. Sound Pressure Level or SPL is the sound or noise measurement expressed as a logarithmic ratio of sound pressure to a reference sound pressure. This logarithmic ratio is the dimensionless unit of Power, the decibel (dB).
SPL = 20 log (p / pref) decibels (dB).
Here, ‘p’ is the root mean square value of the sound pressure in Pa (or N/m2). The reference sound pressure is 0.00002Pa or 2 × 10⁻⁵ N/m2.
A common way to represent sound pressure is dBA. This is a weighted Sound Pressure Level adjusted to the human sensitivity of the human ear.
The following table shows the relationship between Sound Pressure Level in dB and Sound Pressure in Pa.
| Sound Pressure Level (SPL) | Sound Pressure | |
| dBA | Pa | |
| 140 | 200 | Idle Jet Engine |
| 120 | 20 | Discomfort in hearing |
| 110 | 6.3 | Motorcycle at 20 feet |
| 100 | 2 | The sound caused by a Pneumatic Drill |
| 90 | 0.63 | Subway traffic |
| 80 | 0.2 | When someone is shouting |
| 74 | 0.1 | Passing vehicle |
| 60 | 0.02 | If you are having a quiet conversation |
| 50 | 0.0063 | Normal household |
| 40 | 0.002 | Library |
| 30 | 0.00063 | Whispering |
| 20 | 0.0002 | Leaves rustling |
| 0 | 0.00002 | Threshold of hearing (reference sound pressure) |
Noise Level Decibels Chart
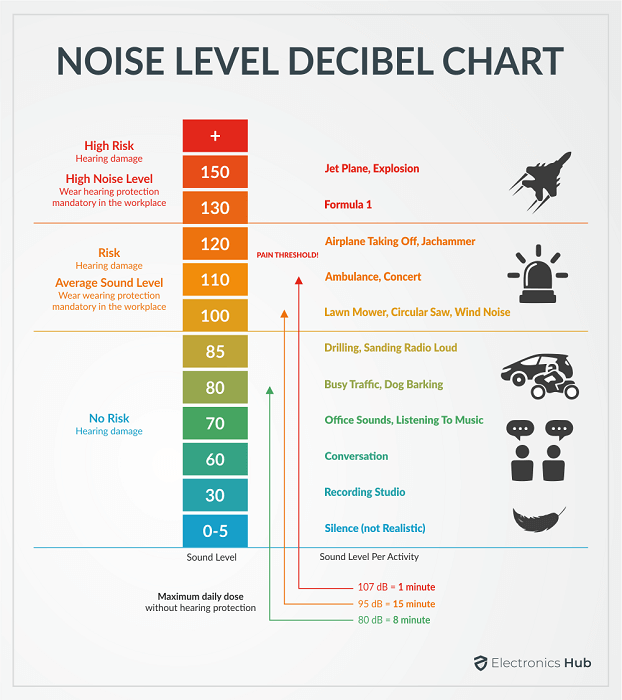
Until now, we saw the basics of Noise and also the measurement of Sound or Noise in Decibels. Now, let us see a Noise Level Decibels Chart that indicates some common noises we encounter and their impact on our ears.
| Source of Noise | Noise Level in decibels (dB) | Impact |
| Fireworks
Gunshots Car Stereos at Full Volume Airplane or Jet Take Off |
140 | Extremely dangerous and painful. Try to use ear protection or completely avoid them. |
| Ambulance
Fire Truck Jackhammers Power Drill Racing Cars |
130 | |
| Jet Engine Idle
Stereo Pneumatic Drill |
120 | Very uncomfortable. Could be dangerous if you listen to more than 30s. |
| Music in Concerts
Car and Truck Horns Stadiums (Sports) Leaf Blower Baby Crying Power Saw |
110 | Very loud noise. Could be dangerous if you listen for more than 30min. Listening to any noise more than 85dB for an extended period can lead to permanent loss of hearing. |
| Music Players at Full Volume
Snowmobiles Boombox |
100 | |
| Electric Drill
Hair Dryers Blenders Lawnmowers Tractor |
90 | |
| Shouting
Alarm Clocks Toaster Doorbell Telephone Ring Food Processor |
80 | Loud noise |
| Moderate Traffic
Vacuum Cleaner TV Audio Coffee Grinder |
70 | |
| Regular Conversation Dishwasher
Washing Machine Sewing Machine |
60 | Moderate noise |
| Normal Household
Light Rainfall Refrigerator Electric Toothbrush Air Conditioner Large Office Environment |
50 | |
| Library
Audio Recording Studio |
40 | Soft noise |
| Whisper | 30 | |
| Rustling leaves | 20 | Faint noise. |
Protect Your Ears
The above Noise Level Decibels Chart is for reference and take these values with a grain of salt. That being said, any noise over 85dB is loud and harmful to the ears.
Overexposure to noise above 70dB for an extended period can cause severe damage to human ears and may even lead to permanent hearing loss.
Use proper hearing protection when you are working with power tools or if you have a construction job.
Here is a table with noise level decibels chart and maximum exposure time.
| Noise Level in dB | Maximum Exposure Time with hearing protection |
| 85 | 8 hours |
| 88 | 4 hours |
| 90 | 2 hours |
| 95 | 1 hour |
| 97 | 30 mins |
| 100 | 15 mins |
| 103 | 7 mins 30 secs |
| 106 | 3 mins 45 secs |
| 109 | 112 secs |
| 112 | 56 secs |
| 115 | 28 secs |
| 118 | 14 secs |
| 121 | 7 secs |
| 124 | 3 secs |
| 127 | 1 sec |
| 130 – 140 | < 1 sec |
| > 140 | No exposure |
Conclusion
We call any ‘unwanted’ sound as Noise. There are several sources of noise such as automobiles, construction works, tools, and industries. Noise Pollution is becoming a serious concern due to the increase in vehicles, heavy industries, power tools, etc. If you have an idea of the levels of noise that is safe for human ears, then we can take proper precaution.
In this guide, we have discussed about the basics of sound and noise. Then we looked at how to measure noise and the meaning of Decibel (dB). Finally, we saw a Noise Level Decibels Chart that lists out some regular sources of noise we encounter. Feel free to share your thoughts or queries with us in the comments section below.