Profit margins are key indicators of a company’s financial health. They show how much money a business makes from each dollar of sales, as a percentage.
Gross profit margin looks at profit after covering direct production costs (COGS). It shows how well a business manages its production. Net profit margin considers all business expenses. This includes COGS, operating costs (rent, salaries, marketing), and other overhead. It shows the overall profitability after all expenses.
Calculating these gross and net profit margins in Excel makes the process simple and quick. With clear margin formulas in Excel, you can easily understand your gross and net profit margins.
How To Calculate Profit Margin Percentages In Excel?
Excel makes it easy to calculate both gross and net profit margin percentages. We’ll break it down into two steps. In each step, we’ll guide you on entering the right formula in Excel with clear examples:
- Calculating Gross Profit Margin
- Calculating Net Profit Margin
How To Calculate Gross Profit Margin In Excel?
The gross profit margin shows the revenue left after covering the direct costs of producing your goods or services. It indicates how efficiently you turn sales into profit before considering any additional business expenses.
Formula to calculate the Gross Profit Margin in Excel:
|
Gross Profit Margin = (Revenue – Cost of Goods Sold) / Revenue * 100% |
Formula Breakdown:
- Revenue: The total income generated from sales of products or services.
- Cost of Goods Sold (COGS): The direct costs associated with producing the goods or services sold, including materials, labor, and manufacturing overhead.
Steps to Calculate Gross Profit Margin in Excel:
- Input Data: Enter your revenue and COGS figures into separate cells in your Excel spreadsheet.
- Calculate Gross Profit: Deduct the COGS value from the revenue value in another cell. This represents the gross profit.
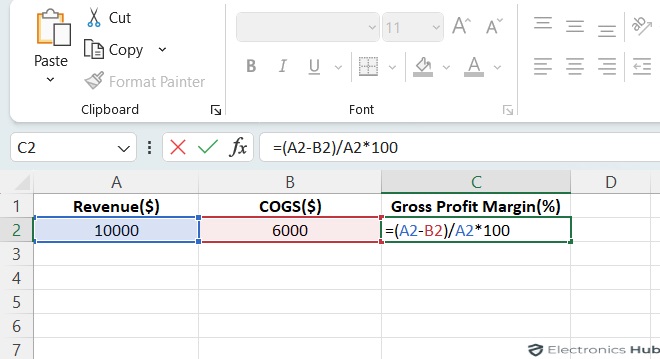
- Apply the Formula: In a different cell, enter the formula = (A2-B2)/A2 * 100 (assuming revenue is in cell A2 and COGS is in cell B2).
- Format as Percentage: Change the cell format to display the result as a percentage.
Gross Profit Margins Calculation Examples:
Let’s say a company has a revenue of $10,000 and a COGS of $6,000.
Gross Profit = $10,000 – $6,000 = $4,000
Gross Profit Margin Percentage = ($4,000 / $10,000) * 100% = 40%
Therefore, the company’s gross profit margin is 40%, indicating that for every dollar of sales, they retain 40 cents after covering the cost of producing the goods.
Excel Formula For Operating Profit Margin:
The operating profit margin is a like a business’s report card on how well it turns sales into profit after covering everyday running costs (rent, salaries, etc.). While Excel doesn’t have a one-click button for this, there are two ways to find it:
Method 1: Direct Calculation
This method directly calculates the operating profit margin as a percentage of revenue. Here, Operating Profit is profit left after covering what you make things with & everyday business costs.
|
Operating Profit Margin (%) = (Operating Profit / Revenue) * 100 |
Method 2: Step-by-Step Calculation
Calculate Operating Profit formula:
|
Operating Profit Margin = (Revenue – COGS – Operating Expenses) |
Calculate Operating Profit Margin as a Percentage formula:
|
Operating Profit Margin (%) = (Operating Profit / Revenue) * 100 |
Both methods give the same answer. The first way is quicker, like a one-step calculation. The second way breaks it down into smaller parts.
No matter which method you choose. Both ways show how good your business is at turning sales into profit after everyday expenses (rent,
salaries, etc.).
Here’s a breakdown of the formula components:
- Operating Profit: This represents the company’s profit after deducting all operating expenses from gross profit. Operating expenses include rent, salaries, marketing costs, depreciation, and other expenses incurred in running the day-to-day business.
- Revenue: This refers to the total income generated by the company from sales of its products or services.
Prepare your data:
Organize your financial data in a spreadsheet with columns for:
- Revenue: Total sales income for the period.
- Cost of Goods Sold (COGS): Direct costs associated with producing the goods or services. (Note: Subtract this from Revenue to get Gross Profit)
- Operating Expenses (OpEx): Indirect costs incurred in running the business (e.g., rent, salaries, marketing).
Calculating Operating Profit With Examples:
In a separate cell, use the following formula to get the operating profit if it’s not directly available:
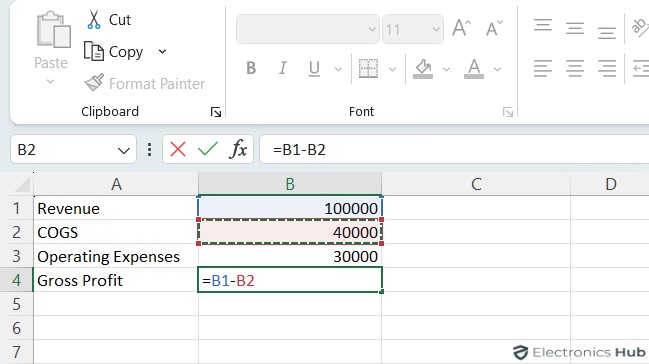
= Gross Profit – Operating Expenses
Where, Gross Profit = Revenue – COGS
Calculate Operating Profit Margin:
In another cell, enter the operating profit margin formula:
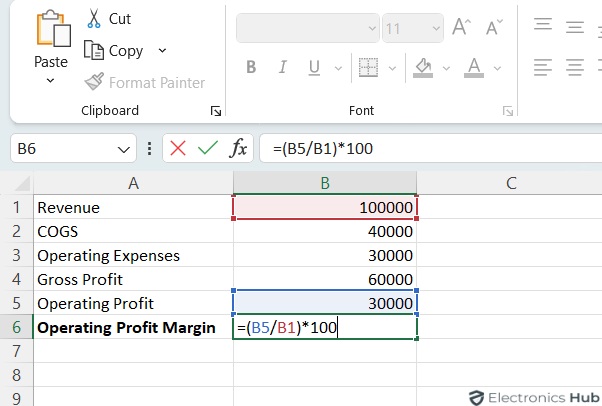
= (Operating Profit / Revenue) * 100
Apply Percentage Formatting:
- Select the cell containing the operating profit margin result.
- On the Home tab, click the Percent Style button (%) to format the value as a percentage.
Example:
Let’s assume a company has the following data:
- Revenue: $100,000
- COGS: $40,000
- Operating Expenses: $30,000
Calculations:
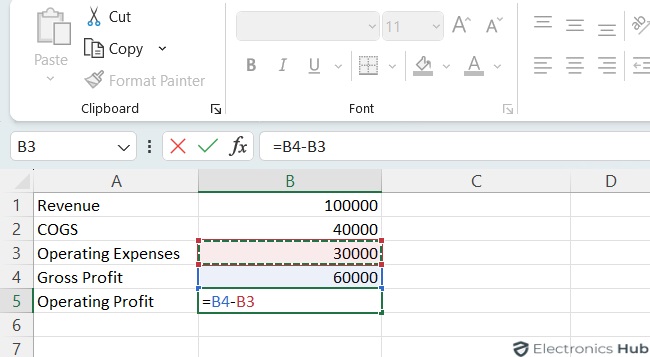
Gross Profit: $100,000 (Revenue) – $40,000 (COGS) = $60,000
Operating Profit: $60,000 (Gross Profit) – $30,000 (Operating Expenses) = $30,000
Operating Profit Margin: ($30,000 / $100,000) * 100 = 30%
How To Calculate Net Profit Margin In Excel?
Net profit margin provides a more comprehensive view of profitability compared to operating profit margin. While operating profit margin focuses on core business operations, net profit margin takes into account all the company’s expenses including interests on debt and taxes
The net profit margin is calculated using the following formula:
|
Net Profit Margin (%) = (Net Profit / Revenue) * 100 |
Where, Net Profit represents the company’s bottom line profit, arrived at by subtracting all expenses from revenue. It considers not only operating expenses (rent, salaries, marketing) but also interest, taxes, and other non-operating expenses.
Calculating Net Profit Margin in Excel:
Here’s a step-by-step guide to calculate the net profit margin in Excel:
Data Preparation: Organize your financial data in a spreadsheet with columns or rows for:
- Revenue
- Cost of Goods Sold (COGS) (Direct costs associated with producing goods or services)
- Operating Expenses (OpEx) (Indirect costs of running the business)
- Interest (Interest expense incurred by the company)
- Taxes (Tax expense incurred by the company)
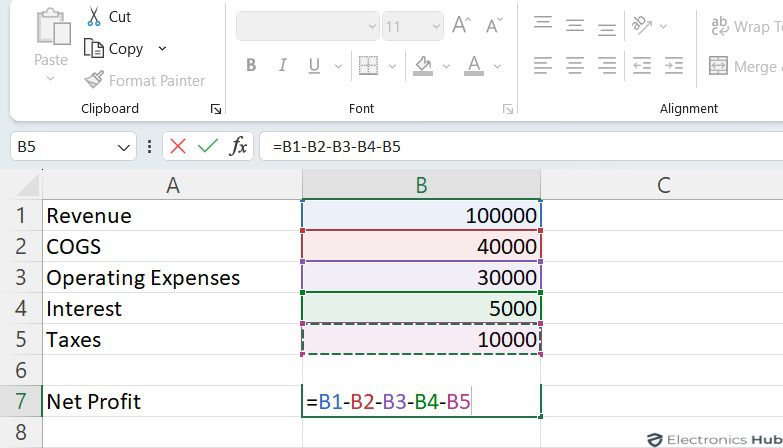
- Net Profit (If not provided, calculate it as Revenue – COGS – OpEx – Interest – Taxes)
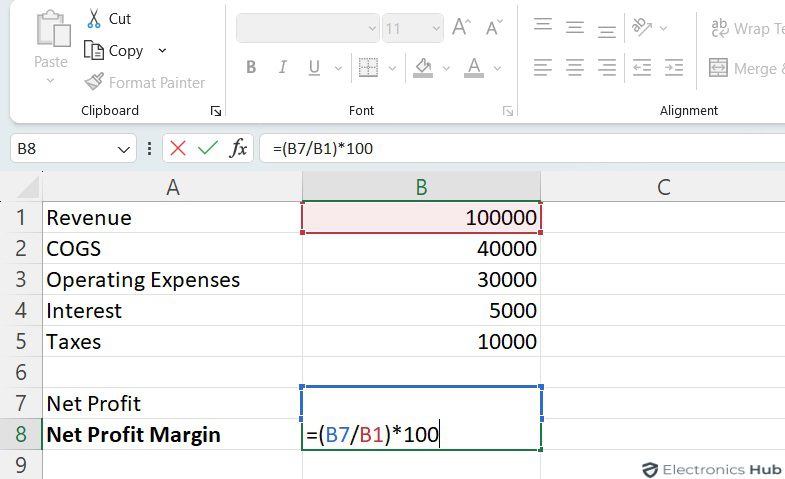
Net Profit Margin Formula: In a separate cell, enter the formula:
= (Net Profit / Revenue) * 100
Percentage Formatting: Apply the Percent Style button (%) on the Home tab to format the result as a percentage.
Example:
- Revenue: $100,000
- COGS: $40,000
- Operating Expenses: $30,000
- Interest: $5,000
- Taxes: $10,000
Net Profit Margin Calculation Examples:
Net Profit: $100,000 (Revenue) – $40,000 (COGS) – $30,000 (OpEx) – $5,000 (Interest) – $10,000 (Taxes) = $15,000
Net Profit Margin: ($15,000 / $100,000) * 100 = 15%
Difference Between Profit Margin and Profit Markup
Profit margin and markup are both ways to measure profitability, but they look at it differently:
- Profit Margin: This shows the percentage of revenue left after subtracting all expenses related to making and selling a product. It tells you how much profit you make for each dollar of sales.
- Profit Markup: This is the percentage increase added to the cost of a product to get the selling price. It shows how much the price is increased from the cost.
Formulas:
- Profit Margin: Profit Margin (%) = (Net Profit / Revenue) * 100
- Profit Markup: Profit Markup (%) = (Gross Profit / Cost of Product) * 100
Key Differences:
- Calculation Basis: Profit margin is based on revenue, while profit markup is based on the cost price.
- Perspective: Profit margin gives an overview of overall profitability, while profit markup focuses on pricing individual products.
FAQs:
It is important for businesses to understand their financial health and make informed decisions. It helps in evaluating profitability, setting prices, and identifying areas for cost savings.
Yes! Enter your revenue, cost of goods sold (COGS), and other expenses in separate columns. Excel formulas can then calculate these profit margins automatically.
Copy your profit margin calculations into new rows for each reporting period. Charts in Excel can then visualize trends over time, helping you identify areas for improvement.
Conclusion
So, that’s it! With these simple formulas, you can now calculate your gross profit margin and net profit margin in Excel. These are golden nuggets of info for any business owner, helping you understand how much profit you’re making after you account for the cost of those awesome products you sell (and all your other business expenses too).