Data analytics is slowly becoming the next hot profession after Big Data and the internet emerged. Data analysis is becoming crucial to companies and businesses to find out their market stance, consumer demands and how to solve issues regarding the business. On top of that, modern companies also use the data analysis report to inform their stakeholders and investors about the company’s growth.
Professionals pursuing a career in the data analysis field can enjoy a stable career. There they can handle different positions, including crucial management positions, due to their skills and knowledge. At present, experienced and expert data analysts are getting a lot of exposure.
In short, data analytics holds a good future with huge career prospects. But, to become a successful data analyst, one needs to get the proper education through the right courses. Since this field is still not explored properly like other conventional technical subjects, finding the right course can be very difficult.
This article tries to help interested students in this regard. You will find all the details regarding the top data analysis courses on different online and offline platforms. We have listed different courses from beginner level to expert level courses for those planning to make a future in data analysis.
Let’s check out all the information to find all the details about the courses and their benefits alongside career prospects.
Beginner Level Courses
1. Tableau 2020 A-Z: Hands-On Tableau Training For Data Science
 If you are someone who needs to start from the basics, this course is the best for you. Tableau 2020A-Z course is a hands-on data analysis course that offers you everything concisely and lucidly to help you.
The Tableau2000 basic course is taught by experienced faculty Kirill Eremenko who has been one of the leading data scientists throughout his career and has mentored students since Udemy started.
The course offers everything for those unaware of Tableau and focuses on gaining solid knowledge. The wheel course is divided into eight Modules for your convenience and each Module combines easy to advanced knowledge seamlessly for better learning.
The course is 8.5 hours, run completely online by the prestigious online platform Udemy. After completing this course, you will get a certificate as well.
What can you learn?
- This course will help you learn about Tableau 2020 and its uses for data analysis for effective decision-making. You can gain knowledge on different business and management factors including
- This course offers lucid language teaching with new data set in each Module as an exercise to practice and learn through practical experience.
- It offers you extensive training on joining and bending the data set and combining the data from different sources to make the best possible data analysis report.
- To present your report, you will also learn to make graphical representations including charts, maps, and interactive dashboards.
Syllabus
MODULE 1: Tableau basics inclduing calculated fields and conversion of data file
MODULE 2: Time Series, Aggregations and filters in tableau
MODULE 3: Maps, Scatterplots, Dashboards inclduing joong data, relationships
MODULE 4: Joining, Blending and Relationships: Plus Dual Axis Chart inclduing fucntions like Left, right, inner and outer joins
MODULE: 5 Table Calculations, Advanced Dashboard and Storytelling
MODULE: 6 Advanced Data Preparation including fixing errors in the tableau
MODULE: 7 Clusters, Custom Territories, Design Features
MODULE: 8 new functions including pdf and viz
2. SQL – MySQL for Data Analytics and Business Intelligence
 The next beginner-level course on this list is an excellent course for those who want to learn about SQL and big data analytics. It is also from Udemy. After learning, you will be able to answer queries on data analysis for business.
The best part about this course is its unique curriculum style. You learn about SQL from the basics and each step to move forward. On top of that, you also get to practice what you learn through the worksheets.
Since this course uses real-life examples, learning becomes more approachable and realistic. One of the best benefits of this course is its pocket-friendly price. The instructor, Sheriff P has been mentoring thousands of professionals on Udemy for the past few years and teaching them about SQL from basics to make the learners expert data analysts.
The whole course duration is 10 hours. The curriculum is divided into 27sections with 287 detailed lectures on each subject.
What will you learn?
- You will learn about salary and income management through SQL in this course.
- This specialized course enhances your analytical reasoning ability and data analysis skills to make useful reports and decisions.
Curriculum
- Introduction to SQL, MySQL
- Theories to SQL
- Installation of mySQL and gaining knowledge
- First steps in SQL
- mySQL constraints
- Best SQL practices
- Employees database
- SQL UPDATE, INSERT, DELETE, SELECT Statements
- Aggregate functions
- SQL Joins, sub queries, and self joins
- Advanced SQL topics
- Combining SQL and Tableau- five tasks
- Finally, query and questions
- A bonus lecture to sum up
3. Beginner Statistics for Data Analytics – Learn the Easy Way!
 This course is also from Udemy under the guidance of eminent Udemy educator Mr. Joseph. He is an eminent corporate finance expert and has been a popular mentor on the Udemy platform. The educator has designed these courses, especially for those new to statistics which need to learn everything from the basic level.
Statistics is a crucial part of data analytics as it helps collect data from the relevant sample, select sampling, and then provide an accurate report by analyzing data. To become a successful data analyst, you need to grasp statistics properly. The beginner-level statistics course is ideal for anyone with minimal knowledge of statistics.
This beginner-level course aims to make learning statistics fun through its 42 lectures of 3 hours and 13-minute long curriculum. For your convenience, the whole curriculum is divided into seven sections.
The course teaches to analyze and synthesize the huge data pool to select the relevant ones to make reports using fundamental statistical tools. On top of that, the brief lectures in lucid language make learning comfortable for anyone!
What does this course teach?
- Fundamentals of statistics without any complicated formulas
- How to perform regression analysis
- Data splitting using scatter plots and histograms
- How to make data-driven decisions with statistics
- Making estimated guesses using statistical methods
- Correlation, standard deviation and other statistical methods
Ideal Students
- Those who want to learn data science
- Recent graduates trying to become a data analyst
- Those who have minimum or no expertise in statistics but want to become a data analyst
Curriculum
- Introduction Chapter
- Statistics fundamentals
- Descriptive statistics
- Inferential statistics and estimates
- Regression analysis
- Creating regression\
- Conclusion class
4. Beginner’s Guide to Data & Data Analytics by SF Data School
 SF data school has designed this special data analytics course for students new to this field. It also has a curriculum handbook with all the written course material to help you learn better.
This course is a detailed online curriculum on Data Science, Data Analytics and data engineering to help learners to grasp everything in detail. It teaches students to encompass the lineage of data to understand other concepts like data pipeline and data collection to perform deep analysis for making a report. This 90-minute long course is a great choice for anyone who needs some theoretical knowledge before gaining practical ones.
What will you learn?
- Differences between data science, data analytics and data engineering
- How to collect data and use those collected data for analysis
- How to use the data meaningfully
- How to select data properly
- Data tools and using these tools to work properly. Alongside you will also learn why some tools are mostly preferred.
- A proper and guided roadmap for data analytics
- What to expect after becoming a data analyst
Curriculum
- Introduction to data analytics
- Roles and skills of data professionals
- Classifications of the used tools in data analytics
- Tool triangle in data analytics
- Types of data files and formats
- Revision lesson
- Prospects
5. Complete Data Analysis Course with Pandas: Python
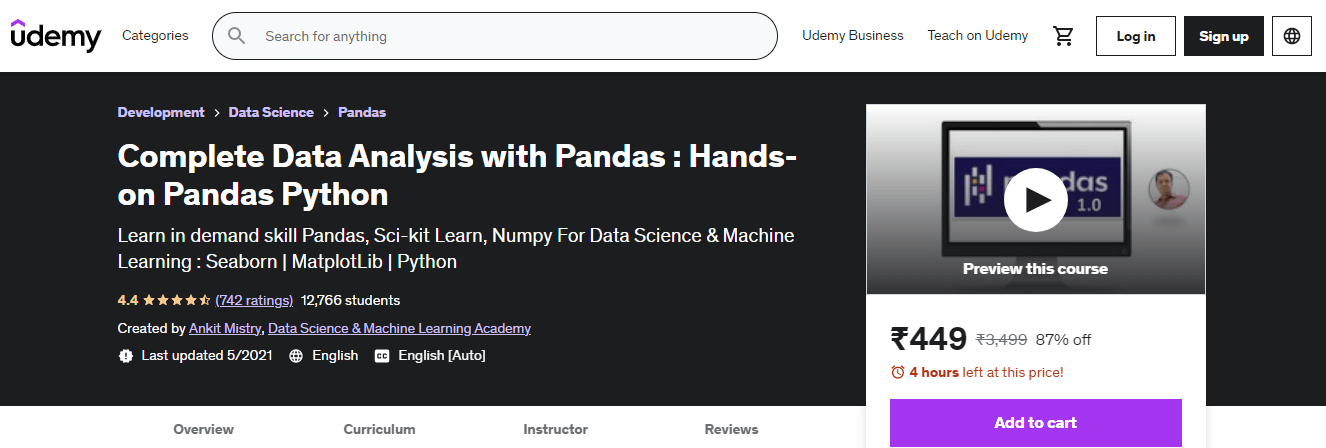 Python is still popular for data analytics and is widely used for global analysis. It is specially designed for beginner cleaners to ensure they become experts on Pandas, NumPy and other Python-related matters for a successful data analyst. The course creator Amit Mistry has designed this course for learners who want to use advanced data analytics tools, including Pandas Library. It uses real-time experience. And lucidly explains using Pandas library and Python for data analytics. After the course, a learner can effectively use Pandas Library for successful data analysis to become a budding data analyst.
The course is divided into 31 sections with 150 lectures of more than 16 hours to offer every detail related to Pandas Library and related tools. The curriculum covers everything concisely and also allows you enough chances to practice.
The transition from the first to the second part is also properly designed to ensure no student is left behind in this self-paced course. You can enroll in this course if you have a PC or laptop with Windows or Linux or Mac support. Your basic programming skills will also help you to understand more about Pandas and NumPy.
What does this course teach?
- It offers you a course on Python and data analysis, Library Pandas, to cover beginner to expert level
- It teaches the basic data structure of Pandas, including Panel. Data Frame and Series. Besides that, this course teaches you to use Text Data with Pandas functions and data importing from different sources before analysis.
- You will learn how to set up Python in an anaconda environment and use it.
- The second part of the course teaches NumPy, including array and matrix
- It also offers detailed knowledge of data visualization by using Seabon Library and Matplotlib.
- You will learn how to implement machine learning workflow by using Scikit-team.
Curriculum
- Data analysis and Pandas
- How to install anaconda and JupyterLab and other Pandas versions
- Downloading python code
- Optional crash course on Python alongside exercises
- Complete details on NumPy, including array, split, concentrate and other functions using array
- creating series using Python and Pandas
- Pandas data frame and attributes
- Panel data type in Pandas
- Options in Pandas
- Data visualization using Pandas
- Importing and exporting data from Pandas
- How to use text data in Pandas
- Data grouping and data framing.
- Time series
- Data cleaning
- Data visualization using MatPlotlib and Seaborn
- Using ML in data analytics]
- Data importing from a remote location
- Reading streaming data
- Preprocessing of the collected data
Intermediate Level Courses
Those with basic level knowledge in data analytics and programming can enhance their professional skill in data analytics by opting for advanced level courses. These courses are also great for professionals who want to re-launch their careers in data analytics.
1. Introduction to Data Analytics for Business
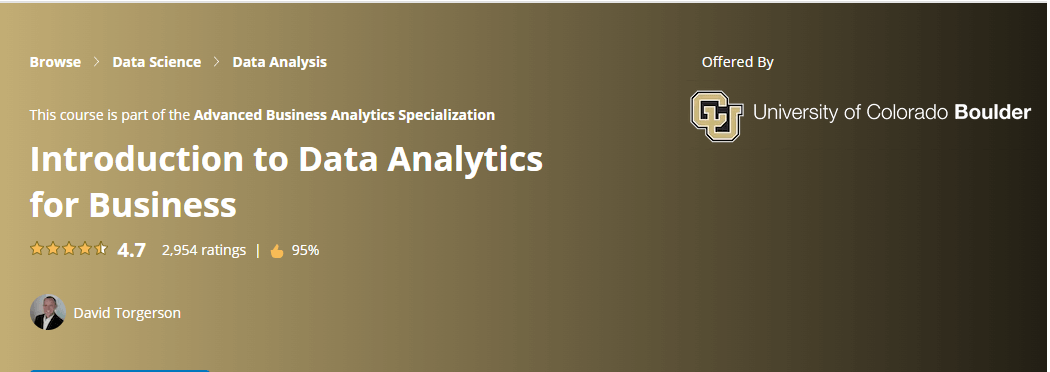 If you are a professional in the business sector, you can learn advanced data analytics for business in this advanced-level course. It teaches you to create data and store and access the data to run an organization effectively. On top of that, it also teaches you to create a data-friendly environment in a business. The University of Colorado Boulder is in charge of this course and issues a shareable certificate to the learners. It is one of the courses from their top five advanced Business Analytics streams.
It offers you a more advanced level of knowledge on investigative and computational methods for businesses and business organizations.
This course is completely online and is taught in English with Portuguese, Vietnamese, and Arabic, and Korean, German, Russian and Spanish subtitles.
The course takes only 12 hours and offers to refresh your skills in data model, data quality, data analysis and SQL.
Curriculum
- Data analysis in the real world- learning and identifying real-time data in the business environment and related factors, including data lifecycle, data privacy, data governance etc
- Analytical tools- Big Data, cloud technologies and related ideas used in data analytics
- Data extraction using basic SQL commands and coming and stacking of the collected data
- How organizations use the data and execute the data analytics
2. Microsoft Excel – Advanced Excel Formulas & Functions
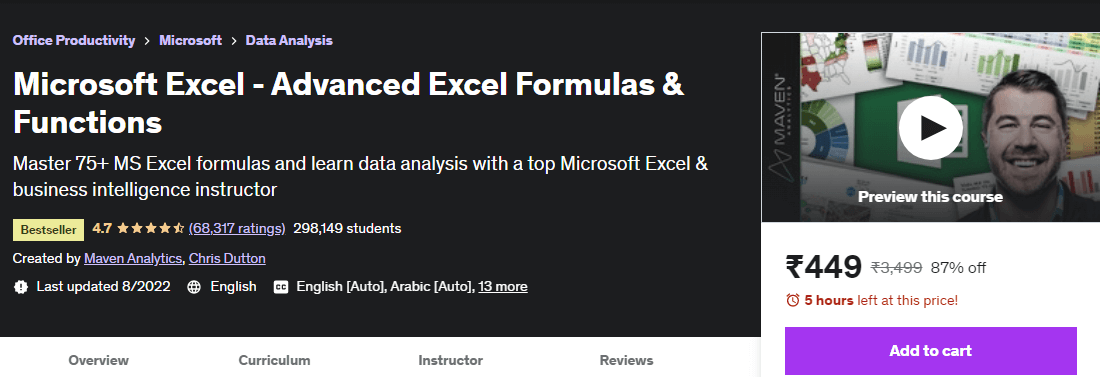 Microsoft Excel is one of the most used spreadsheet software in data analytics. If you have previous experience with Excel, it is an ideal choice for you to learn how to use this for data analytics. It is a course created by Maven Analytics, one of the leading institutes for data intelligence training.
What does this course teach?
- Using Excel formulas for data analysis
- Remote, streamline data and work using an excel spreadsheet
- Advanced excel functions, including Dynamic Arrays and HLOOKUP
Curriculum
- Advanced formulas in Excel
- Conditional Statements and logical operators, including IF statement, AND/OR, NOT, IFERROR functions
- Simple excel statistical functions and text functions
- Data and time functions
- Formula based formatting
- Dynamic array formats
3. Data Analysis with Pandas and Python
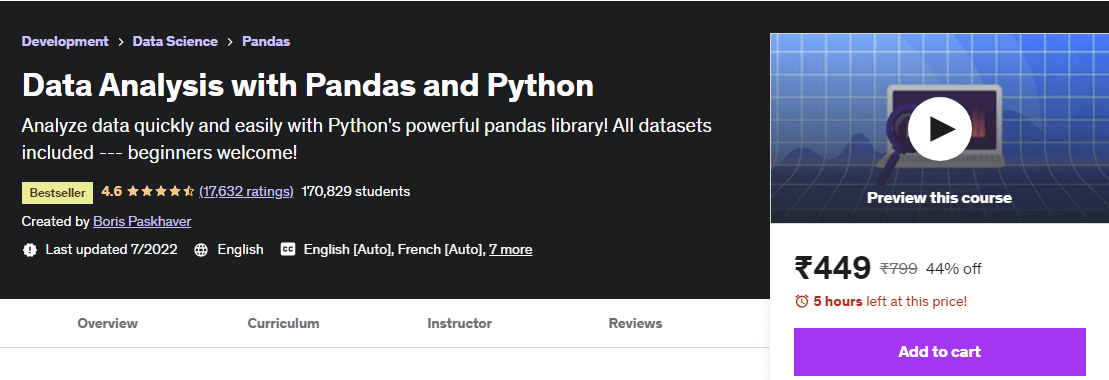 Those with intermediate-level knowledge in spreadsheet software, python language and data types can enroll in this advanced level course to advance towards their goal of becoming successful data analytics experts.
The curriculum is divided into fifteen sections to teach Python, data frames, and Panda library functions.
What does this course teach you?
- It offers you a concise knowledge of advanced level Python programming and Pandas Library, including joining, grouping and pivoting data.
- Offers pandas library advanced functions
- Helps to learn about data manipulation in 1D, 2D, and 3D data sets
- How to resolve issues related to incomplete or broken data sets
Curriculum
- Installation of Python and Panda Library
- Python crash course
- Data series
- Data frames- introduction, filtrating data, extraction, joining, concentrating, merging.
- How to use text data
- Dealing with times and dates in datasets
- Input and output in pandas
- Data visualization
- Advanced options in pandas
4. R Level 1 – Data Analytics with R
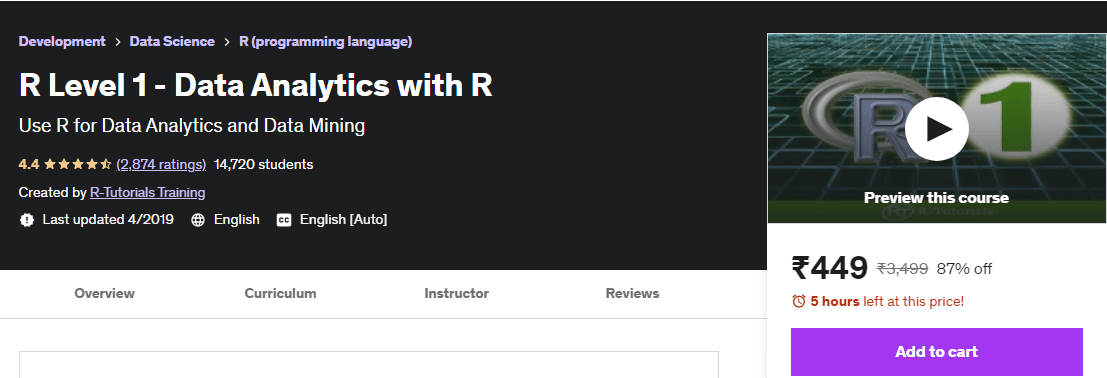 The R1 level data analytics course from Dataquest is an excellent choice for those who want to use programming for data analytics. Dataquest has already made its name by offering data science-based online courses through their interactive teaching and project-based learning.
This R-level course offers learners detailed programming knowledge, including R path and SQL, so you can produce accurate reports faster with the data.
Syllabus
- R suntan instructions
- Data structures including loops, iterations, functions, control flow
- Data visualization and data cleaning
- SQL basics
- R path- extracting data from APIs, web scraping and intermediate statics in R
- Probability- basic and intermediate level knowledge with conditional probability
- Hypothesis testing
- Linear aggression and machine learning basic course
- How to use interactive web apps with R path
5. Advanced Business Analytics Specialization
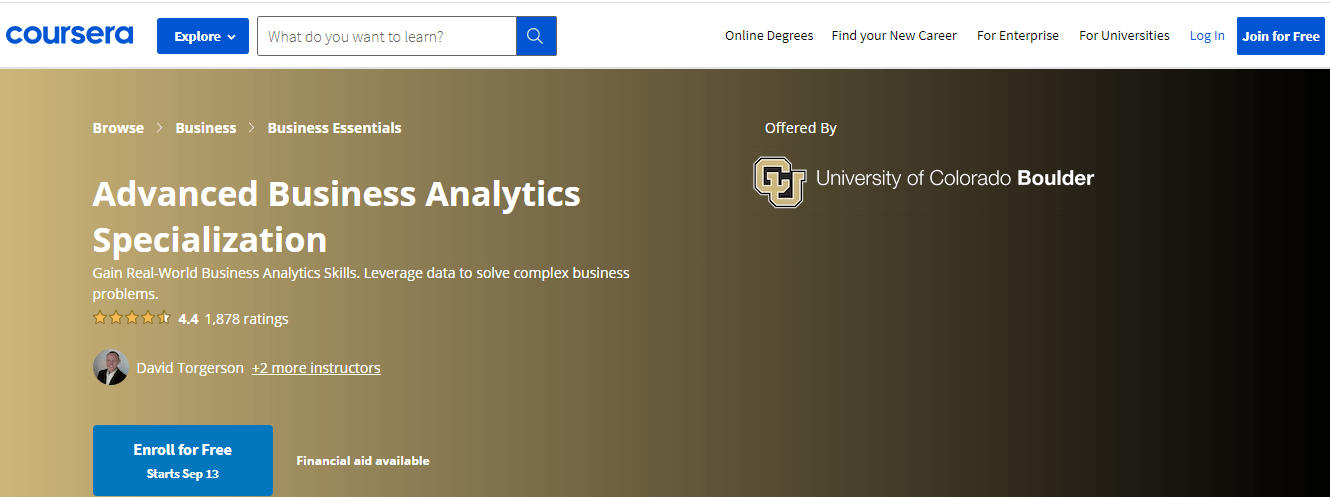 The Advanced Business Analytics Specialization course is a detailed course of dive moths with three hours of lectures per week. It is specially created to teach students about data leveraging and offering solutions for complex business situations. If you have basic data analytics knowledge, you will enjoy the whole course to learn more about data visualization, mathematical optimization and AQL.
It is available on Coursera in collaboration with the University of Colorado Boulder. The course also uses projects to help learners learn in a realistic environment for a complete educational experience. Each chapter comes with a project that every student must complete to move forward under the guidance of the instructors. After completing the course, students will receive a certificate.
Courses included in this course.
The whole course is divided into five smaller courses-
- Introduction to Data Analytics for Business
- Predictive Modeling and Analytics
- Business Analytics for Decision Making
- Communicating Business Analytics Results
- Advanced Business Analytics Capstone
Bonus Courses
6. Data Analytics for Lean Six Sigma
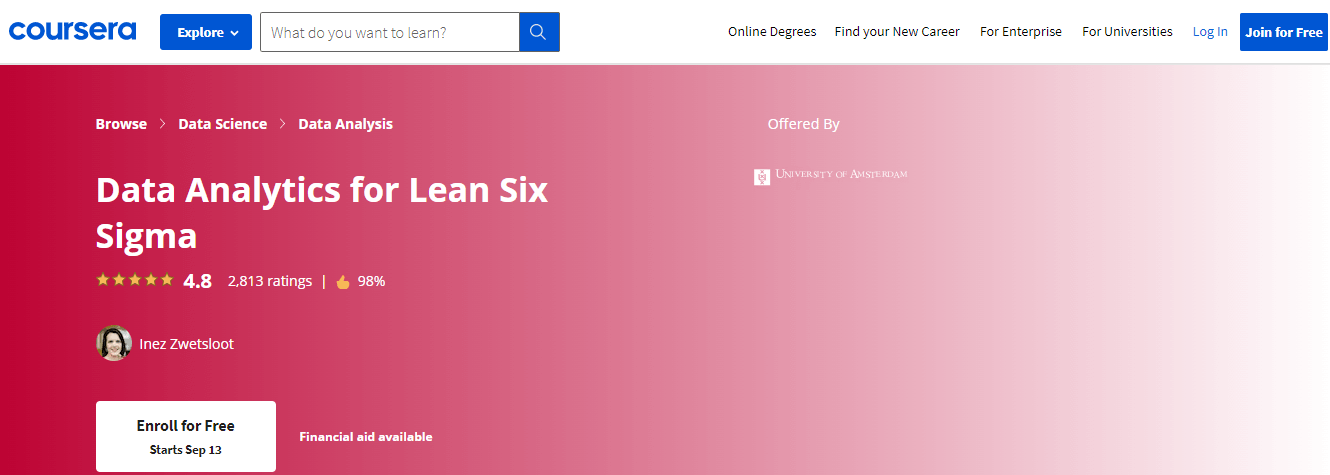 The advanced course on Data Analytics for lean six sigma is a completely online course offered on Coursera from the University of Amsterdam under Professor Inez Zwetsloot.
It is specially designed for students who want to learn about variation reduction and waste removal from data analytics reports. It uses different data analytic techniques for Lean Six Sigma Improvement projects. After completion, you will learn about using Lean Six Sigma improvements and using data analytics effectively.
What can you learn?
- Data and Lean Six Sigma
- Understanding and visualizing data
- How to use probability distributions
- Testing
- Using numerical Y and categorical X in testing
- Introduction to ANOVA
- Myitlab
- Kruskal-Wallis test
- Lognormal, normal and Weibull distributions
- Pareto analysis
- Population sampling
- Selecting CTQs
- Visualizing numerical and categorical data
7. Health Information Literacy for Data Analytics Specialization
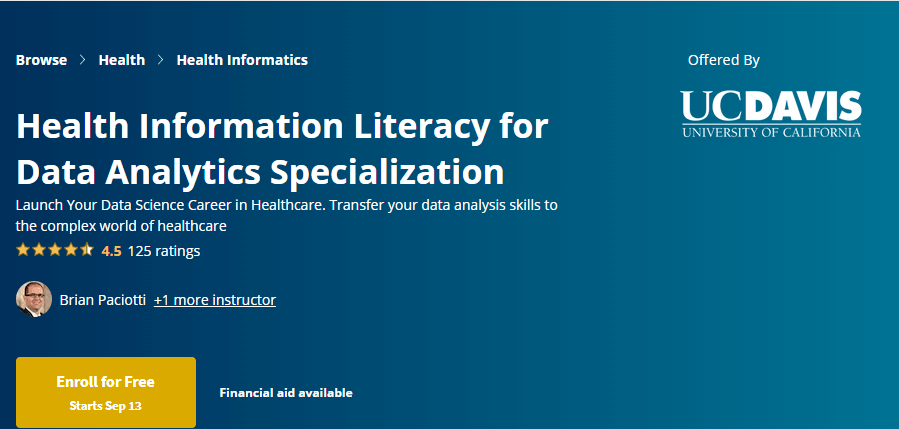 University of California, Davis offers this special course that teaches how to use data analytics for health information literacy. In recent times, the healthcare industry is rapidly opening itself to data analytics to offer better patient literacy and more secure services with privacy. It is a course for those already working as data analytics experts for at least two years.
The fully online course completes in four months, with three study hours per week. It is taught in English with subtitles in Italian, German, Russian, Spanish, Arabic, Portuguese, and Vietnamese etc.
The whole course is divided into four smaller courses. A learner needs to complete each course with project works to proceed further. After completing the course successfully, learners will also receive a certificate from UC Davis.
What does this course teach you?
- How to analyze different types of healthcare data, including claims, patient-generated data, and operational and clinical data.
- Common data models used in the healthcare sector
- Checking the quality of the healthcare data to make appropriate decisions
- Creating a valuable data dictionary
Syllabus and Topics Covered
- Healthcare data literacy
- Healthcare data models
- Healthcare data quality and governance
- Analytical solutions to common healthcare problems
Recommended Tutorial
8. Become a Data Analyst: Nanodegree Program by Udacity
 It is a four-month-long nanodegree program on Data analytics from Udacity. The course is open to learners already experienced with Python (standard libraries including Pandas and NumPy) and SQL. The fully online course is presented in collaboration with Kaggle. The whole course offers real-world projects under the guidance of expert educators to help learners learn with real-life experiences.
Syllabus
- Introduction to data analysis, including wrangling, exploring, analyzing, and communicating using Pandas and NumPy
- Statistical methods and probability methods like the AB test used in data analytics
- Data visualization using Python
Conclusion
Data analytics is becoming one of the most promising professions for the next decade. Since this field is still somewhat unexplored, talented individuals can get good career prospects after learning Data analytics. The article details the best course offered on the subject- from base to advanced level.
You can enroll in any course from this list as per your technical knowledge and career prospects. Besides, professionals who want to become data analysts can also enroll in any listed courses to propel their careers.

One Response
Thank you for the wonderful content. It is really helpful. Thanks a lot.