Monitoring your PC’s temperature is a crucial aspect of maintaining its health and performance. Understanding and managing temperature levels within your computer is vital to prevent overheating, which can lead to overheating, hardware damage, reduced performance, and system instability. But how to check PC temperature? In this guide, we will explore various methods for checking PC temperature (mostly CPU but also GPU), both software-based and hardware-based, to help you keep your computer running smoothly and within safe temperature ranges.
We’ll also discuss the importance of monitoring temperature, potential risks of overheating, and what to do if temperatures are too high (how to lower CPU temperature). Whether you’re a casual user or a PC enthusiast, knowing how to check and manage your PC’s temperature is essential for ensuring its longevity and optimal performance.
Importance of Monitoring PC Temperature
Monitoring the temperature of your PC is a crucial aspect of maintaining the health and performance of your computer system. As computers have become more powerful and compact, they generate a significant amount of heat during operation. This heat can lead to a range of problems if not properly managed and monitored.
Overheating can cause permanent damage to critical components such as the CPU (Central Processing Unit), GPU (Graphics Processing Unit), motherboard, and RAM. These components are sensitive to high temperatures and can experience reduced lifespan or even complete failure if they consistently operate at elevated temperatures.
Excessive heat can lead to system instability, resulting in crashes, freezes, and unexpected shutdowns. When a PC reaches its thermal limits, it may throttle its performance to reduce heat, leading to reduced computing power and slower operation.
High temperatures can negatively impact the performance of your computer. Modern processors and GPUs are designed to operate efficiently within specific temperature ranges. If temperatures rise beyond these ranges, the hardware may automatically slow down to prevent overheating. Monitoring temperatures allows you to identify and address issues that might be hindering your PC’s performance.
Overheating can lead to data corruption or loss, especially if the system crashes unexpectedly due to heat-related issues. Safeguarding your data by keeping your PC at optimal temperatures is essential, especially for critical tasks and important files.
How to Check PC Temperature?
Built-in Tools
Software-based methods are the easiest and most convenient way to check your PC’s temperature without any additional software installation. Here, we’ll explore how to use built-in tools on both Windows and macOS to monitor your computer’s temperature.
1. Windows Task Manager
Strangely, the most popular operating system doesn’t have a proper built-in tool to monitor the CPU temperature. You can use the Windows Task Manager to at least check the GPU temperature.
Open the Task Manager. You can open Task Manager in several ways.
- Press “Ctrl + Shift + Esc” on your keyboard.
- Right-click on the taskbar and select “Task Manager.”
- Press “Ctrl + Alt + Delete’ and then choose “Task Manager” from the options menu.
In the Task Manager window, you’ll see multiple tabs on the left. Click on the “Performance” tab to access performance-related information.
In the “Performance” tab, you’ll find various graphs and information about your computer’s performance. On the left sidebar, select “GPU.” Here, you’ll see the current GPU temperature listed under the name of the GPU itself.
2. UEFI/BIOS
Another “built-in” software-based methods for checking PC temperature involve accessing the BIOS (Basic Input/Output System) or UEFI (Unified Extensible Firmware Interface) settings. This method provides a direct look at the hardware’s temperature readings and settings.
To access the BIOS or UEFI settings, you need to start by restarting your computer or powering it on if it is currently off. Accessing the BIOS/UEFI interface during boot is direct way. Typically, as your computer boots up, there is a brief moment during which you can access the BIOS or UEFI settings. The specific key to press varies depending on your computer’s manufacturer but is commonly one of the following keys:
- For BIOS: Del, F2, F10, F12, Esc, or another key indicated on the boot screen.
- For UEFI: Esc, F2, Del, or a manufacturer-specific key like ASUS’ F8, MSI’s F11, or Gigabyte’s F12.
Start pressing the key repeatedly as soon as you power on your PC or as soon as you see the manufacturer’s logo. It is crucial to press the key at the right time to access the settings.
Once you’ve successfully entered the BIOS or UEFI interface, you’ll be presented with a menu or screen with various options. The exact layout and options can vary significantly between different motherboards and manufacturers.
Look for an option related to hardware monitoring or system status. It might be labeled as “PC Health,” “Hardware Monitor,” “System Information,” or something similar. You may need to refer to your motherboard’s user manual or online resources if you’re unsure where to locate this section.
For older BIOS-based systems, use the arrow keys on your keyboard to navigate through the menus and find the hardware monitoring section. Modern UEFI systems have nice GUI that we can access/control using mouse.
Within the hardware monitoring section, you should find temperature readings for various components such as the CPU, GPU, motherboard, and sometimes other components like the hard drive. Temperatures are usually displayed in degrees Celsius (°C). Some BIOS/UEFI interfaces may also allow you to change the temperature unit to Fahrenheit (°F) if desired.
Take note of the temperature values displayed for each component. Pay close attention to any values that seem unusually high or close to the maximum recommended operating temperatures for your specific hardware.
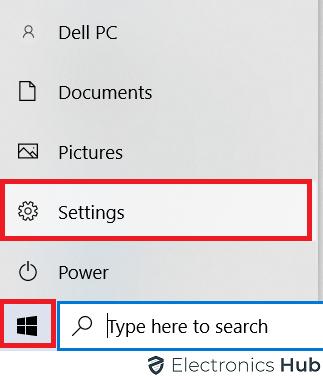
There is an alternative way to enter the computer’s UEFI/BIOS settings in Windows. This is much simpler than repeatedly pressing the BIOS key (which could be a hit or a miss depending on your timing). In Windows 10, click on the Start menu and then click on the “Settings” option (the one with the cog wheel).
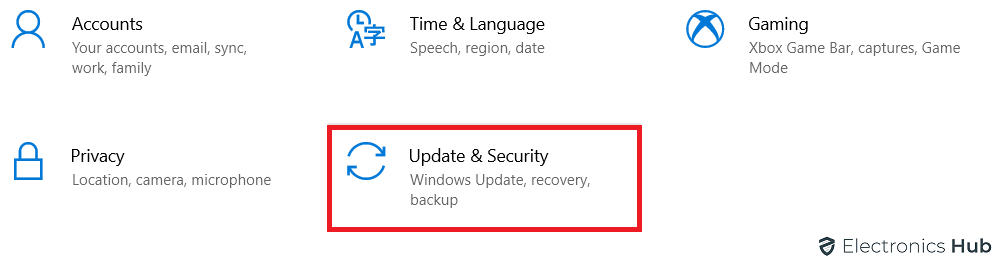
You’ll see “Update & Security” tab at the bottom of the Windows Settings page. Click on it.
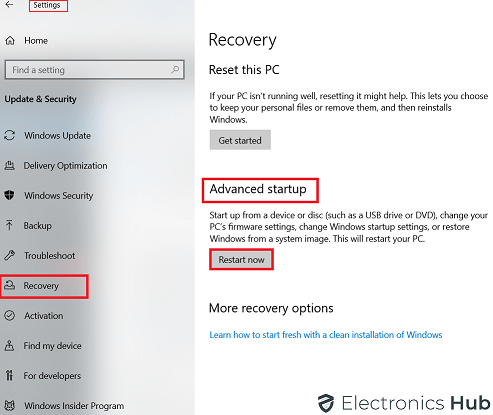
Now, select the “Recovery” option from the left sidebar. The main window on the right changes accordingly. There will be the “Advanced startup” heading. Select the “Restart now” button. Your computer will undergo the Restart process. Don’t interfere with the computer during this action.
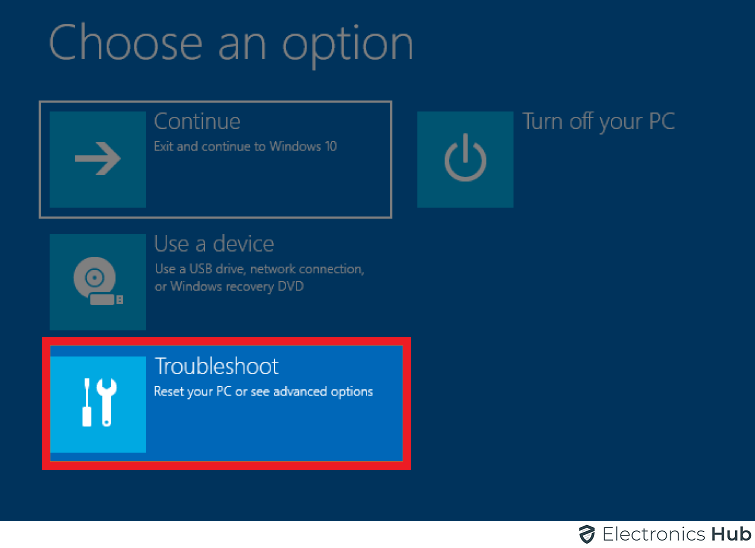
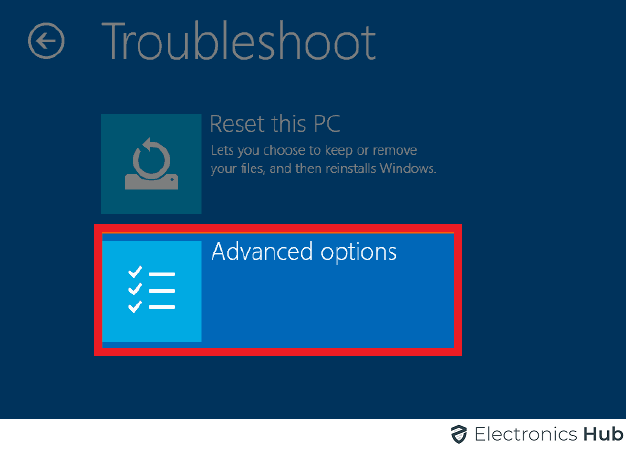
Once the system boots, select the “Troubleshoot” from the list of options.
Then select “Advanced options” on the screen.
You can see a UEFI Firmware Settings option on the screen. Click on it.
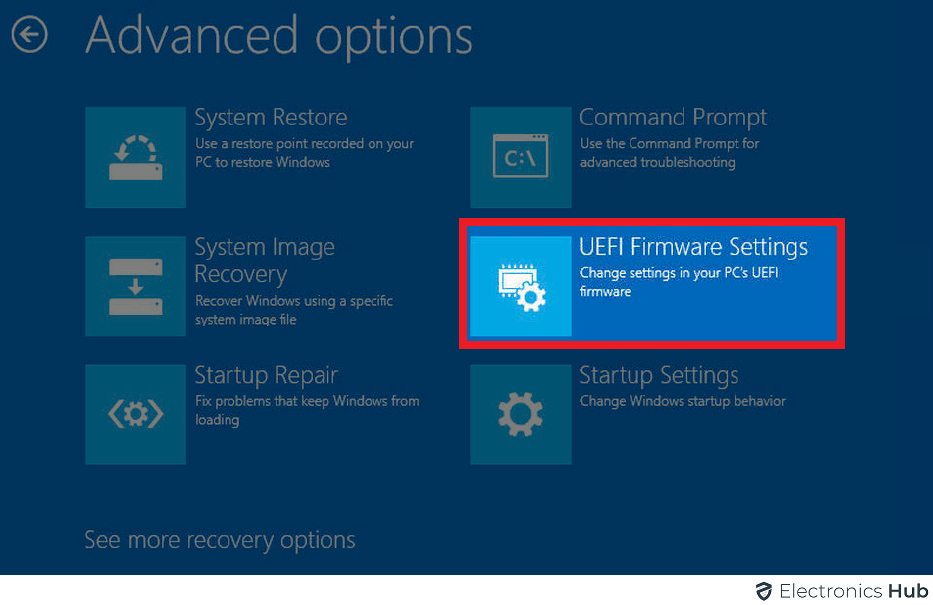
Finally, click on the “Restart” option to boot into BIOS/UEFI.

Accessing the BIOS/UEFI settings is a direct and reliable way to monitor your PC’s temperature. It provides a baseline measurement of your hardware’s temperature, allowing you to assess whether it is within safe operating limits. Keep in mind that while this method is useful for periodic checks, it doesn’t offer real-time monitoring or historical data like some software-based solutions do.
Using built-in tools provides a basic level of temperature monitoring. However, these tools may not offer as much detail and customization as third-party software. If you need more advanced monitoring features or want to track additional temperature sensors, you may consider using third-party software such as Core Temp, HWMonitor, HWiNFO, etc. (for Windows), or other alternatives tailored to your specific needs.
Third-Party Software
Third-party software offers more advanced and feature-rich options for monitoring your PC’s temperature and other vital parameters. Start by researching and selecting a suitable temperature monitoring software based on your operating system and preferences. Popular choices include:
- Core Temp
- HWMonitor
- Open Hardware Monitor
- HWiNFO
- SpeedFan
- Speccy
- AIDA64
- MSI Afterburner
- NZXT CAM
- AMD Ryzen Master
1. Core Temp
Core Temp is a popular and widely-used temperature monitoring software specifically designed to provide real-time temperature data for your CPU. It is a valuable tool for users who want to keep an eye on their CPU’s temperature to ensure it stays within safe operating limits. Here’s an overview of how to use Core Temp software.
Visit the official Core Temp website to obtain the latest version of the software. Download the installer, and run it to initiate the installation process. Follow the on-screen instructions to install Core Temp. Once the installation is complete, launch Core Temp by locating it in your computer’s Start menu (Windows).
When you launch Core Temp, you’ll see a straightforward and user-friendly interface. It typically displays the following information:
- CPU Model: The software will identify your CPU model and display it at the top of the window.
- Temperature Readings: Core Temp will list each CPU core separately, showing the current temperature of each core in Celsius (°C).
- Voltage and Power: Apart from temperature, Core Temp also displays the Core Voltage and various Power readings.
- System Tray Icon: Core Temp often places an icon in the system tray (bottom right corner of your screen) for quick access. You can right-click this icon to access options and settings.
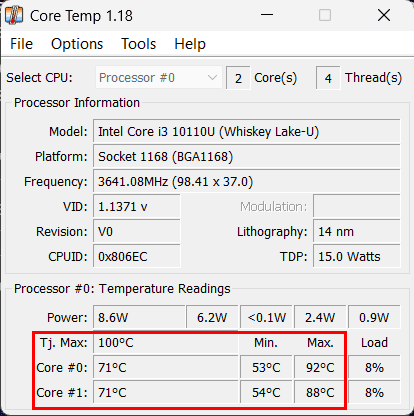
Core Temp focuses on providing temperature data for your CPU, so you won’t find GPU or motherboard temperature readings within the software. You can customize temperature readings in the notification area by color-coding them for easy identification: green indicates a safe temperature range, while yellow and red indicate rising temperatures that may need attention. Core Temp also provides additional information, such as the Tj. Max (maximum junction temperature) for your CPU and the distance to Tj. Max, which gives you an idea of how close your CPU is to its maximum safe temperature.
Core Temp allows you to set up temperature alerts and customize the software to meet your needs. To configure alerts, go to the “Options” menu and select “Overheat Protection.” Here, you can set temperature thresholds that trigger warnings or actions, such as shutting down the computer.
In the “Settings” menu, you can adjust various options, including the display of temperature units (Celsius or Fahrenheit), skin customization, and more. Core Temp offers a logging feature that allows you to record temperature data over time. You can access this feature by going to the “Tools” menu and selecting “Log File.” Additionally, Core Temp provides a built-in graphing feature that visualizes temperature changes over time, helping you spot trends and patterns.
Core Temp is a valuable tool for CPU temperature monitoring and can help you maintain your computer’s performance and longevity by ensuring that it operates within safe temperature ranges.
2. HWMonitor
HWMonitor is a widely used and reliable hardware monitoring software that allows users to keep track of various parameters, including temperature, fan speed, and voltage, for their computer’s components. To start using HWMonitor, you can download the latest version from the official HWMonitor website. Once downloaded, proceed to install the software on your Windows system, following the simple on-screen instructions.
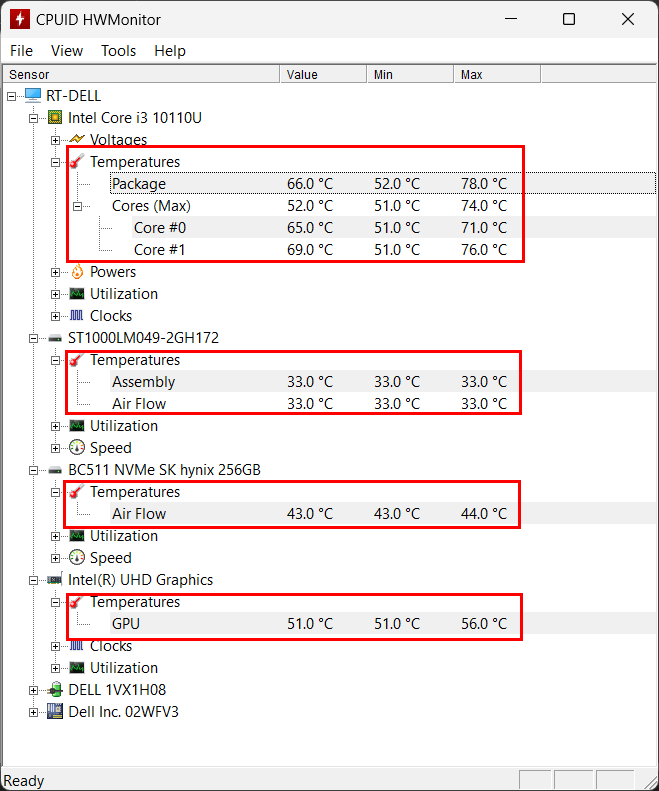
Upon installation, launch HWMonitor, which presents an intuitive interface. The main window displays a comprehensive list of hardware components along with their associated parameters. Typically, temperature readings for different components such as the CPU, GPU, RAM, and hard drives are prominently featured. To access temperature data, locate the “Temperatures” section within the HWMonitor window. Here, you can inspect the temperatures of key hardware elements, all presented in degrees Celsius (°C).
In addition to temperature data, HWMonitor offers insights into fan speeds and voltage levels. These vital details can be found in separate sections labeled “Fans” and “Voltages.” Fan speeds are measured in revolutions per minute (RPM), while voltage levels are presented in volts (V).
3. Open Hardware Monitor
Open Hardware Monitor is a robust, open-source software designed for monitoring hardware parameters in real-time, providing users with vital information about their computer’s components, including temperature, clock speed, power, and more. To get started with Open Hardware Monitor, visit its official website to obtain the latest version. There is no need to install anything as all you have to do is open the executable from the downloaded zip file with admin privileges.
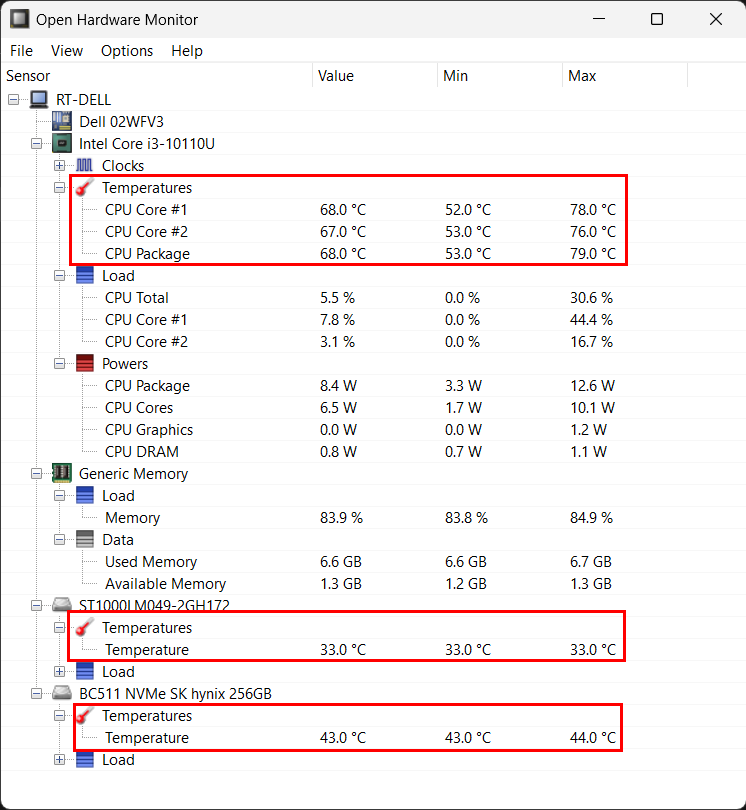
You’ll be greeted with a user-friendly interface displaying a comprehensive list of hardware components and their associated parameters. This includes temperature readings for your CPU, GPU, RAM, and other components, all presented in degrees Celsius (°C).
Additionally, Open Hardware Monitor also displays power, clock speeds, load for all compatible hardware. You can view the temperature readings in a plot for visual monitoring.
4. HWiNFO
HWiNFO, or Hardware Information, is a robust hardware monitoring and information tool designed to offer a comprehensive overview of your computer’s hardware components and real-time monitoring of critical parameters, including temperature, voltage, fan speed, and more. To get started with HWiNFO, visit the official HWiNFO website to download the latest version. You can choose between the installer version, which requires installation, and the portable version that can be run directly from a folder. Once installed or extracted, launch HWiNFO by locating it in your Start menu (Windows) or the folder where you placed the portable version. Depending on your system type (32-bit or 64-bit), the name of the application will either be HWiNFO32 or HWiNFO64.
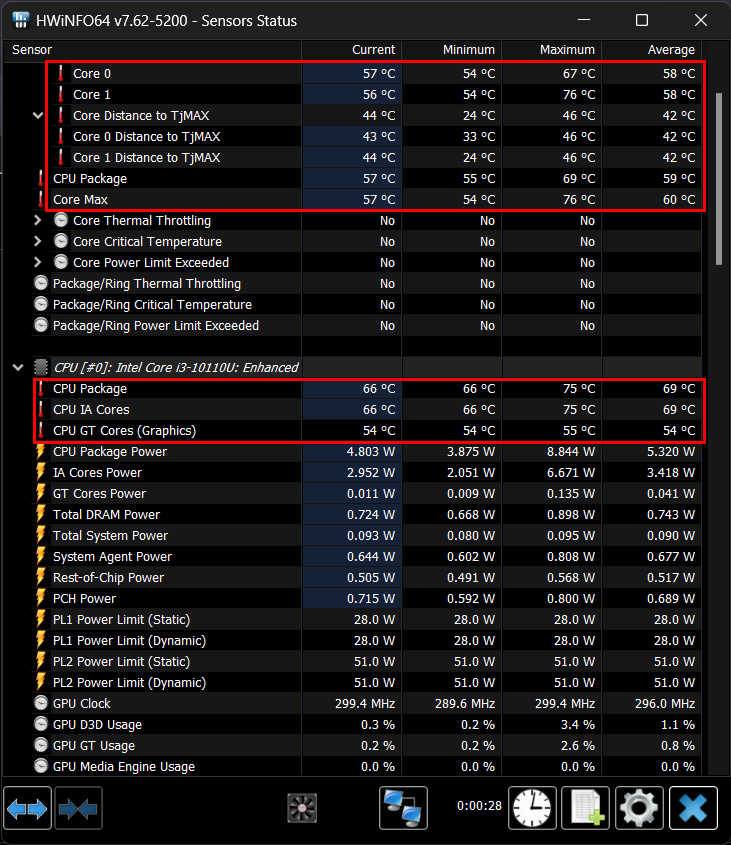
HWiNFO provides an extensive and detailed interface that covers various aspects of your computer’s hardware. The primary interface includes several sections.
- Summary: Here, you’ll find a summarized overview of your computer’s hardware, including information about the CPU, GPU, motherboard, RAM, storage devices, and more.
- Sensors: This section displays real-time monitoring data for temperature, voltage, fan speed, and power usage across different hardware components. You can expand each component to access detailed sensor readings.
- Memory: This section provides a quick overview of all the memory modules in the system such as clock, Timings, and many more.
To access temperature data, navigate to the “Sensors” section in HWiNFO. Within this section, expand the categories relevant to the hardware components you wish to monitor, such as the CPU, GPU, motherboard, or storage devices. Detailed information about temperature readings, voltage levels, fan speeds, and more will be readily available for each component.
For customization and setting up alerts, navigate to the “Settings” menu. Here, you can configure sensor settings, customize the interface’s appearance, enable or disable logging, and establish alerts for sensor readings that surpass defined thresholds. Additionally, HWiNFO features logging capabilities that allow you to record sensor data over time. You can find this feature in the “Logging” section next to the “Settings.” Moreover, you can graph sensor data to visualize temperature trends and fluctuations by right-clicking the parameter and selecting “Show Graph”.
5. SpeedFan
SpeedFan is a versatile utility software known for its ability to monitor and control various aspects of a computer’s hardware, primarily focusing on temperature monitoring and fan speed control. It serves as a valuable tool for users who want to maintain optimal cooling and keep their system temperatures in check, as well as gain insights into their hardware’s performance. To start using SpeedFan, you can download the latest version from its official website. After downloading, run the installer and follow the on-screen instructions to complete the installation process.
Once installed, launch SpeedFan by locating it in your Start menu (Windows). The SpeedFan interface may not be the most visually appealing, but it offers a comprehensive view of your hardware. The main window displays temperature readings for various components, fan speeds, and voltage levels. You can access different tabs and options for controlling fan speeds and customizing temperature monitoring.
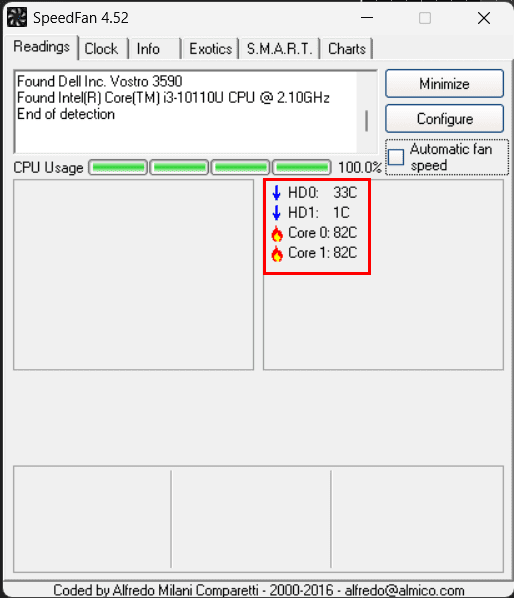
For temperature data, head to the “Readings” tab within the SpeedFan window. Here, you’ll find temperature readings for important components like the CPU, GPU, hard drives, and motherboard, typically presented in degrees Celsius (°C). SpeedFan also allows manual adjustment of fan speeds for compatible hardware components. To control fan speeds, navigate to the “Fan Control” tab in the “Configure” section, where you can set specific fan speeds or create custom profiles based on temperature thresholds.
6. Speccy
Speccy, developed by Piriform, is a versatile utility software aimed at providing users with detailed insights into their computer’s hardware. It serves as an excellent resource for gathering comprehensive system information, monitoring hardware components, and addressing hardware-related concerns. To get started with Speccy, visit the official Piriform website to access the latest version. Download the installer, run it, and follow the on-screen instructions for a straightforward installation process. Once installed, you can conveniently launch Speccy from your Windows Start menu.
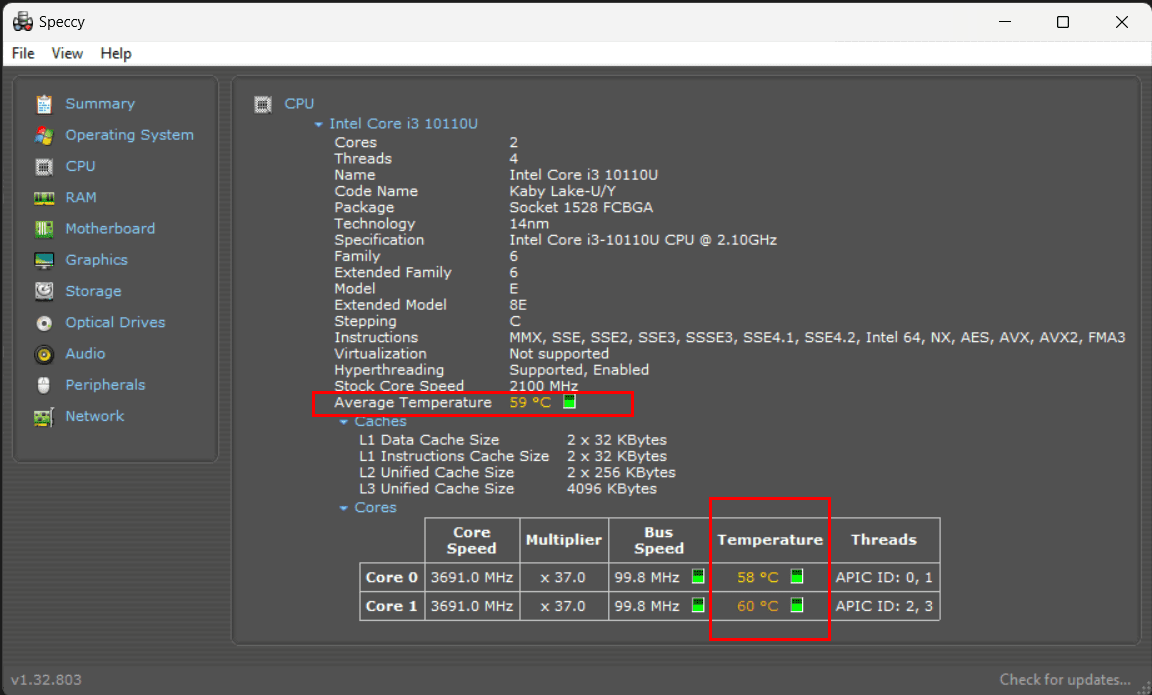
The Speccy interface is user-friendly and organized into various tabs, each dedicated to specific aspects of your computer’s hardware and software. These tabs include “Summary,” “Operating System,” “CPU,” “RAM,” “Motherboard,” “Graphics,” “Storage,” “Optical Drives,” “Audio,” “Peripherals,” and “Network.” The “Summary” tab offers a quick overview of your system, including key details about the operating system, CPU, RAM, and motherboard. Clicking on individual tabs provides more in-depth information about specific components, such as the CPU model, architecture, clock speed, and core count.
Speccy also allows users to monitor real-time temperature readings for critical components like the CPU, motherboard, and storage devices. This feature is particularly valuable for keeping an eye on system temperatures and ensuring that they stay within safe limits.
7. AIDA64
AIDA64, previously known as Everest, stands as a comprehensive system information and diagnostic software utility developed by FinalWire Ltd. This versatile tool offers an array of features for system monitoring, benchmarking, and hardware testing, making it a favorite among tech enthusiasts, IT professionals, and system administrators. To begin using AIDA64, you can download the latest version from the official AIDA64 website or a trusted software source, with the installer available for Windows. Installation involves running the downloaded installer and following the on-screen prompts, ensuring a straightforward setup process.
Upon installation, you can launch AIDA64 from your Windows Start menu. The interface of AIDA64 is highly organized, featuring an extensive list of system information categories on the left sidebar. These categories encompass a wide range of hardware and software components, including “Computer,” “Motherboard,” “Operating System,” “Display,” “Storage,” “Network,” and more. Clicking on any category reveals detailed information about the selected component in the main window.
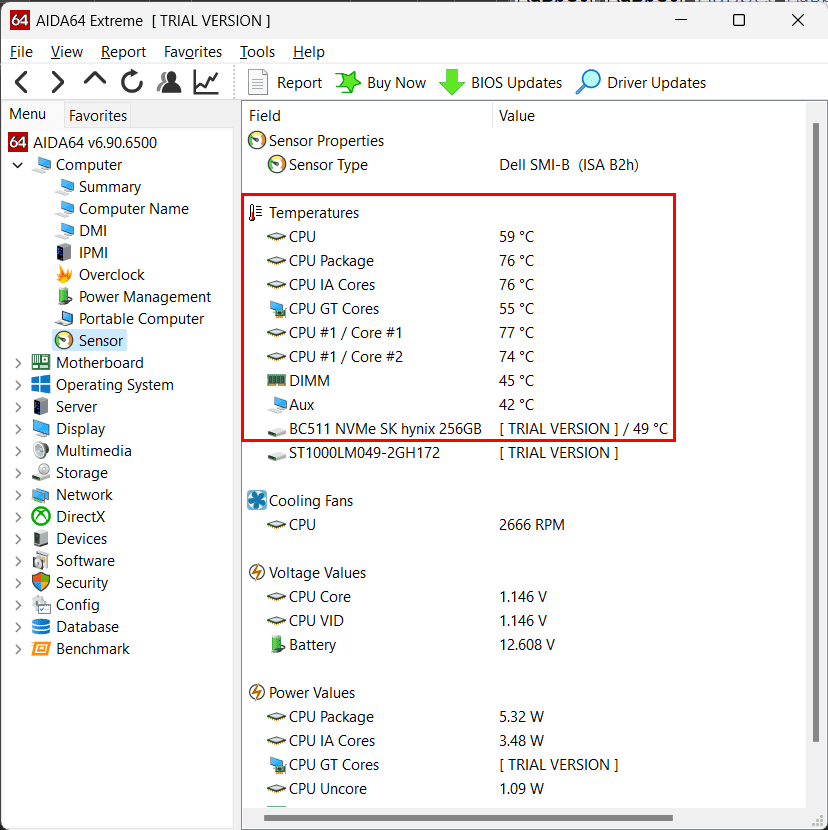
AIDA64 excels in providing comprehensive system information. By starting with the “Computer” category, you’ll obtain an overview of your system, including specifics about your CPU, motherboard, BIOS, and more. Exploring other categories grants access to in-depth details about various hardware and software components, such as RAM, GPU, storage devices, and network adapters.
The software’s real-time monitoring capabilities are also notable. The “Sensor” section enables users to monitor temperature readings, fan speeds, voltage levels, and other critical hardware parameters. Users can customize sensor preferences and configure alerts to be triggered when specific thresholds are reached.
8. MSI Afterburner
MSI Afterburner, a versatile software tool designed primarily for graphics card overclocking and monitoring, is a valuable resource for keeping tabs on both CPU and GPU. Users can rely on this software to provide real-time temperature monitoring capabilities, ensuring that their processor and graphics card operates within safe temperature ranges.
To begin using MSI Afterburner for temperature monitoring, start by downloading and installing the software from the official MSI Afterburner website. Once installed, launch the program, and you’ll encounter a user-friendly interface that includes sliders for GPU clock speeds, fan speed controls, and temperature monitoring.
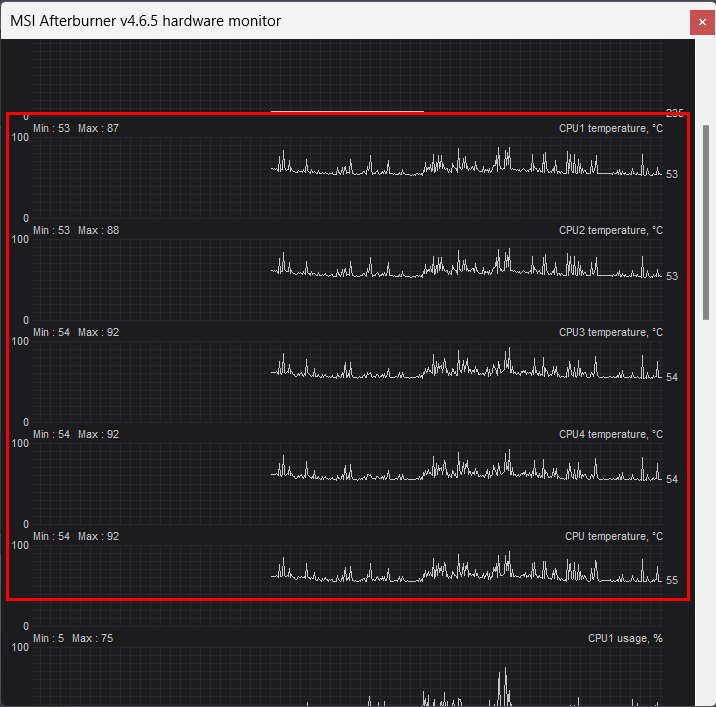
One of the primary functions of MSI Afterburner is GPU overclocking. Users can fine-tune their graphics cards by adjusting core clock and memory clock settings to enhance performance. A very useful feature here is the real-time temperature monitoring function, where users can observe their CPU and GPU’s current temperature in degrees Celsius (°C). This temperature reading is typically displayed as a numerical value or visually represented on the interface as a plot.
9. NZXT CAM
NZXT CAM software is a versatile utility designed to monitor and manage various aspects of your computer’s hardware, with a particular emphasis on temperature monitoring. It is a valuable tool for gamers, PC enthusiasts, and users who want to keep a close watch on their system’s health. To get started with NZXT CAM, you can download the latest version from the official NZXT CAM website. Once downloaded, run the installer and follow the on-screen instructions for a seamless installation process.
After installation, launch NZXT CAM from your Start menu or desktop. The software offers a user-friendly interface organized into several tabs for monitoring different hardware parameters. To access temperature monitoring, navigate to the “Monitoring” or “Dashboard” tab, where you’ll find real-time temperature readings for essential components like the CPU, GPU, motherboard, and storage devices. These temperature readings are typically displayed in degrees Celsius (°C) and can be presented graphically or as numerical values.
10. AMD Ryzen Master
AMD Ryzen Master stands as a robust software utility developed by AMD, catering to users of AMD Ryzen processors for CPU monitoring and management, including temperature monitoring. It provides a comprehensive view of the performance of Ryzen CPUs and offers the ability to fine-tune various settings. This software is particularly valuable for overclocking enthusiasts, PC enthusiasts, and users keen on closely monitoring their CPU temperatures. To get started with AMD Ryzen Master, simply visit the official AMD website and download the latest version of the software. Run the installer, follow the on-screen instructions, and complete the installation process.
After installation, you can launch AMD Ryzen Master from your desktop or Start menu. The interface is well-structured, accommodating users of various experience levels, and grants access to CPU parameters and temperature monitoring features. In the main interface, you’ll find key CPU information such as model, core count, clock speed, and real-time temperature readings, typically displayed in degrees Celsius (°C), allowing continuous monitoring of temperature variations.
Beyond temperature monitoring, AMD Ryzen Master provides advanced options for fine-tuning Ryzen CPU performance, including core control and Precision Boost Overdrive (PBO). While utilizing these features, you have to keep an eye on temperature readings to ensure that the CPU remains within safe operating temperature ranges.
Hardware Temperature Monitors
When opting for dedicated hardware temperature monitoring, you’ll need to purchase a dedicated temperature monitoring device. These devices come in various forms, such as temperature probes, sensors, or LCD displays, and can be found online or at computer hardware stores.
Installation
Before installation, ensure that your PC is powered off and unplugged to avoid any electrical hazards. Open your PC case to access the interior. Locate an appropriate spot inside your PC case to install the temperature monitor. Ideal locations include near the CPU heatsink, GPU, or other critical components you want to monitor.
Depending on the type of hardware monitor you’ve purchased, you may need to attach temperature probes or sensors to specific components. These sensors typically come with adhesive backing or clips for easy attachment. Securely fasten the monitor or display to the case using screws or adhesive strips, ensuring it is positioned for easy viewing and reading.
Hardware temperature monitors usually come with a display or interface that provides real-time temperature readings. These displays may be integrated into the monitor or provided as a separate unit.
Monitor
Connect the monitor’s cable to a compatible display interface or USB port on your PC. Some monitors may require additional power connections, so follow the manufacturer’s instructions.
Install any necessary drivers or software provided with the hardware monitor. This software allows you to configure the monitor, customize temperature alerts, and calibrate the sensors if needed.
Once the hardware temperature monitor is set up and connected, it will start displaying real-time temperature readings for the monitored components.
Interpret Temperature Data
Interpret the temperature readings carefully. Each component, such as the CPU, GPU, and motherboard, should ideally stay within safe temperature ranges during normal operation. Refer to manufacturer guidelines for acceptable temperature limits for your specific hardware.
Keep an eye on temperature trends over time. Sudden spikes in temperature may indicate cooling problems or high system loads.
Customize temperature alerts if your hardware monitor supports them. Alerts can notify you if temperatures exceed predefined thresholds, allowing you to take action to prevent overheating or hardware damage.
Regularly check and maintain your hardware temperature monitor, ensuring it remains accurate and functional. Replace temperature probes or sensors if they become faulty or outdated.
Using dedicated hardware temperature monitors provides precise and localized temperature data, which can be especially helpful for users who want to monitor specific components closely. By following these steps, you can effectively set up a hardware temperature monitor inside your PC case, ensuring that you can keep a vigilant eye on critical temperatures and take necessary measures to maintain your computer’s health and performance.
What is a Normal CPU and GPU Temperature?
Typical temperature ranges for computer components, including the CPU (Central Processing Unit), GPU (Graphics Processing Unit), and motherboard, can vary based on the specific hardware, usage scenarios, and environmental conditions. Here are general temperature ranges to consider:
CPU Temperature
Idle CPU temperatures, when the computer is not under load and performing basic tasks like web browsing or word processing, typically range from 30°C to 50°C. Modern CPUs often have lower idle temperatures due to power-saving features.
During intense tasks like gaming, video editing, or running demanding software, CPU temperatures can rise significantly. A safe range under load is usually between 50°C and 80°C. High-end air or liquid cooling solutions can keep temperatures lower.
Most CPUs have a critical temperature threshold (usually around 90°C to 100°C), beyond which they will throttle their performance or shut down to prevent damage. It is crucial to avoid reaching or exceeding this threshold.
GPU Temperature
Similar to CPUs, idle GPU temperatures range from 30°C to 50°C, depending on the model and cooling solution.
During gaming or graphics-intensive tasks, GPU temperatures typically range from 60°C to 85°C. High-end gaming GPUs may have higher load temperatures, but they are designed to handle it. GPUs also have critical temperature thresholds (around 90°C to 100°C) to prevent overheating.
Motherboard Temperature
Motherboard temperature at idle depends on factors like the ambient temperature, case airflow, and motherboard design. It is usually around 30°C to 40°C.
When the CPU and GPU are under load, the motherboard temperature can rise, especially around the VRM (Voltage Regulator Module) area. A typical range under load is 40°C to 60°C. High-end motherboards may have better VRM cooling.
These temperature ranges are approximate and can vary based on factors such as the specific CPU and GPU models, cooling solutions, case airflow, thermal paste quality, and overclocking.
What to Do if CPU Temperatures Are Too High?
Clean the PC
Over time, dust and debris can accumulate inside your PC case, blocking airflow and causing components to overheat. Use compressed air or an ESD-safe vacuum cleaner to remove dust from fans, heatsinks, and other internal components. Regular cleaning can significantly improve airflow and reduce temperatures.
Check for Proper Airflow and Ventilation
Ensure that your PC case has proper airflow. Make sure that intake and exhaust fans are correctly configured for efficient cooling. Consider adding additional fans if your case supports them. Cable management can also play a role in maintaining good airflow.
Reapply Thermal Paste
Over time, the thermal paste between your CPU/GPU and their respective heatsinks can degrade, leading to poor heat transfer. If temperatures are consistently high, consider reapplying thermal paste. Remove the old paste, clean the surfaces, and apply fresh thermal paste following manufacturer guidelines.
Upgrade Cooling Solutions
Adding or upgrading your cooling solutions can significantly lower temperatures. This can involve adding more fans to your case, installing a larger CPU cooler, or even transitioning to liquid cooling for enhanced thermal performance. Choose cooling solutions that are compatible with your hardware and case.
Reduce System Load
High temperatures may result from running resource-intensive applications or games. Reduce system load by closing unnecessary background applications and optimizing in-game settings. Lowering graphical settings can also reduce GPU load and heat generation.
Monitor Temperature Over Time
Continuously monitor your system’s temperature over time to ensure consistency. Use software monitoring tools to track temperature trends and identify any persistent overheating issues. Consistency in temperature readings helps confirm that your cooling solutions and adjustments are effective.
If high temperatures persist despite these measures, it may be necessary to consider hardware upgrades or replacements. Components like CPUs and GPUs have maximum temperature limits, and consistently operating near or above those limits can lead to reduced performance and potential long-term damage. Therefore, addressing high temperatures promptly is crucial to maintaining the health and longevity of your computer.
Does Temperature Affect CPU/GPU Performance?
Yes, temperature can significantly affect the performance of both CPUs (Central Processing Units) and GPUs (Graphics Processing Units). When a CPU gets too hot, it may engage in a process called thermal throttling. In this state, the CPU reduces its clock speed and performance to lower heat generation and prevent overheating. This is a protective measure to avoid damaging the CPU.
As the CPU temperature rises, it becomes less efficient at processing instructions. This can result in slower performance, longer response times, and reduced multitasking capabilities. Extremely high temperatures can lead to system instability, causing crashes, freezes, and unexpected shutdowns.
GPUs also engage in thermal throttling when temperatures become excessive. Like CPUs, they lower their clock speeds to mitigate heat. This can result in decreased frame rates and lower graphical performance in games and GPU-intensive applications. High GPU temperatures may lead to graphical artifacts, screen tearing, and glitches in graphics-intensive tasks. These issues can compromise the quality of gaming and visual experiences.
Prolonged exposure to high temperatures can potentially shorten the lifespan of both CPUs and GPUs. While modern components have built-in safety features to protect against overheating, running at high temperatures for extended periods can contribute to long-term wear and tear.
To maintain optimal CPU and GPU performance and avoid performance degradation, it is crucial to keep their temperatures within safe operating ranges. This can be achieved through effective cooling solutions, regular system maintenance, and monitoring temperature levels during demanding tasks.
Conclusion
Monitoring your PC’s temperature is not just a precautionary measure; it is a fundamental aspect of computer maintenance. By using built-in tools, third-party software, and dedicated hardware monitors, you can stay informed about your PC’s thermal health. With this knowledge, you can take proactive steps to prevent overheating, such as cleaning your PC, optimizing airflow, upgrading cooling solutions, or reducing system load. By paying attention to temperature warnings and practicing good temperature management, you can extend the lifespan of your hardware, maintain consistent performance, and enjoy a trouble-free computing experience. So, keep a watchful eye on your PC’s temperature, and your system will thank you with reliable and efficient operation.
FAQs
Why is Monitoring PC Temperature Important?
Answer: Monitoring PC temperature is essential because overheating can lead to hardware damage, reduced performance, and system instability. By keeping an eye on temperature levels, you can prevent these issues and ensure the longevity of your components.
What Temperature Range is Considered Safe for CPUs and GPUs?
Answer: Safe temperature ranges vary depending on the specific CPU and GPU models, but as a general guideline, most CPUs and GPUs should ideally stay below 80°C under load. However, always refer to your hardware manufacturer’s recommendations for precise temperature limits.
What Should I Do If My PC is Overheating?
Answer: If your PC is overheating, you can take several actions to address the issue, such as cleaning the PC to remove dust and debris, ensuring proper airflow and ventilation, reapplying thermal paste to the CPU/GPU, upgrading cooling solutions, reducing system load, and monitoring temperature trends over time.
What Software Can I Use to Monitor PC Temperature?
Answer: There are various software options for monitoring PC temperature, including Core Temp, HWiNFO, MSI Afterburner, NZXT CAM, and Open Hardware Monitor. These programs offer real-time temperature readings and additional system information.
Do RAM and Storage Drives have built-In Temperature Sensors?
Answer: Most PCs do not have built-in temperature sensors for RAM or storage drives. While some high-end motherboards may include these features, they are not as common as sensors for CPUs and GPUs. Monitoring software can provide limited information about storage drive temperatures, but it’s generally not as precise.
Can I Trust Third-Party Temperature Monitoring Software?
Answer: Reputable third-party temperature monitoring software is generally trustworthy. However, it is essential to download software from official sources or trusted repositories to avoid potentially malicious or unreliable programs. Always ensure that you are using well-established and frequently updated monitoring tools.