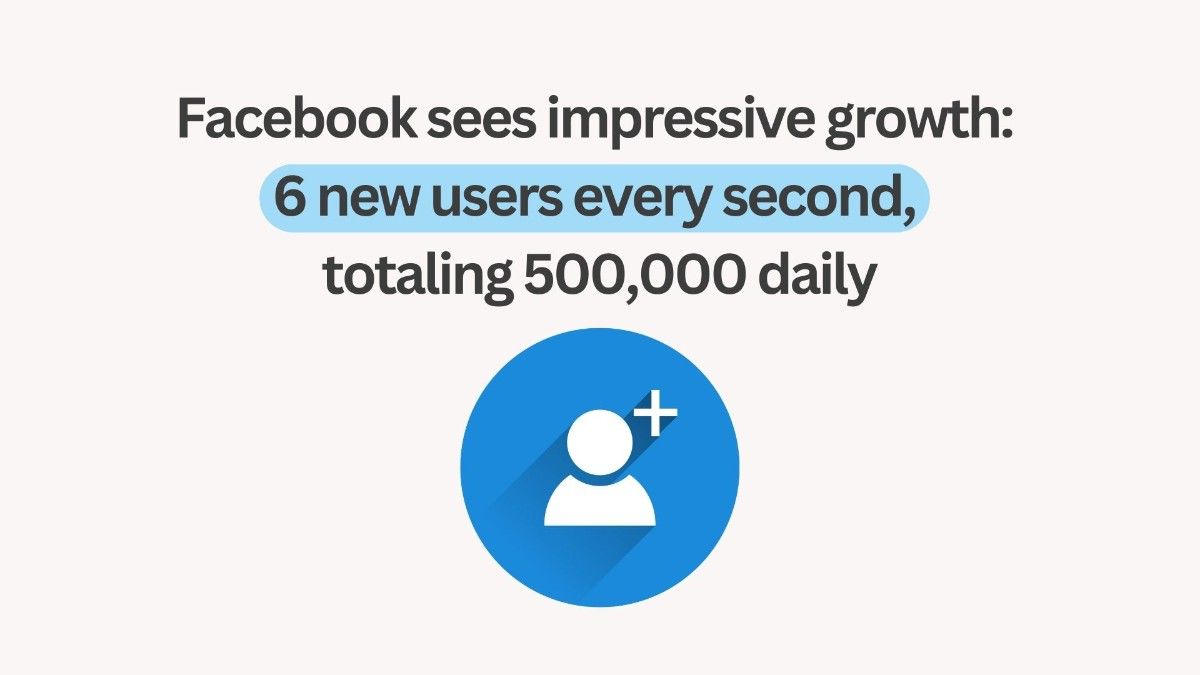
Facebook Statistics 2024: Facebook isn’t going anywhere. With over 3 billion monthly active users, it remains the undisputed king of social media platforms. Since its humble beginnings in a dorm room, Facebook has grown at an astronomical rate, connecting billions of people across the globe. This exponential rise isn’t slowing down either. Year-over-year, when you look at these Facebook statistics, there’s a continuous growth in both monthly and daily active users.
While other platforms may grab headlines, Facebook’s sheer user base and consistent growth make it a force to be reckoned with. So, how many people are using Facebook in 2024? What are the latest features that are making the buzz? What’s in store for Facebook in the next five years or so? Have these questions? Here, you’re about to find all the latest statistical data on how popular this social networking platform is.

|
Top Facebook Statistics (Editor’s Pick)
|
Facebook: A Timeline (2004-2024)

Early Days (2004-2006)
- February 4, 2004: “TheFacebook” launches at Harvard University by Mark Zuckerberg and his fellow students.
- April 13, 2004: Facebook is incorporated as a limited liability company (LLC).
- June 2004: Facebook receives its first official investment.
- September 2004: A lawsuit is filed against Facebook by ConnectU, claiming copyright infringement.
- August 2005: Facebook acquires the domain name facebook.com and drops “The” from its name.
- December 2005: The “Tagging” feature is introduced, allowing users to identify people in photos.
- 2006: The revolutionary “News Feed” launches, personalizing user experiences.
Mobile Revolution and Platform Expansion (2007-2010)
- January 2007: Facebook takes the mobile leap with a mobile-friendly version.
- May 2007: Facebook Platform opens its doors to developers, fostering third-party app creation.
- November 2007: Facebook Beacon, a controversial advertising program, is launched (later discontinued in 2009).
- June 2008: The lawsuit with ConnectU is settled.
- October 2008: Facebook establishes its international headquarters in Dublin, Ireland.
- February 2009: The now-ubiquitous “Like” button makes its debut.
- November 2009: Facebook Beacon is shut down due to privacy concerns.
Acquisitions and The Rise of a Social Media Giant (2010-2020)
- 2010s: Facebook experiences explosive growth, becoming the dominant social media platform globally.
- 2012: Facebook acquires the immensely popular photo and video sharing platform, Instagram.
- 2014: Oculus VR, a virtual reality technology company, is acquired by Facebook.
- 2015: Facebook makes its biggest acquisition yet, purchasing the messaging giant WhatsApp.
- 2016: Issues around fake news and misinformation on the platform begin to gain significant attention.
- 2018: Facebook unveils Portal, a smart speaker with video calling capabilities (later discontinued in 2022).
- 2020: Facebook Gaming, a dedicated streaming platform, is launched.
The Meta Era and Beyond (2021-2024):
- 2021: Facebook announces its transformation into Meta Platforms Inc., signaling a shift towards the Metaverse, a virtual reality-centered future.
- 2022: Facebook experiments with live shopping features, but ultimately decides to discontinue them.
- 2023: Meta Verified, a subscription service offering verification badges and other perks, is launched.
- 2024 (and beyond): As of today, Facebook remains a powerful social media platform but also faces ongoing challenges concerning privacy, misinformation, and competition from emerging platforms.
Facebook User Statistics
How many Facebook users are there right now (2024)?
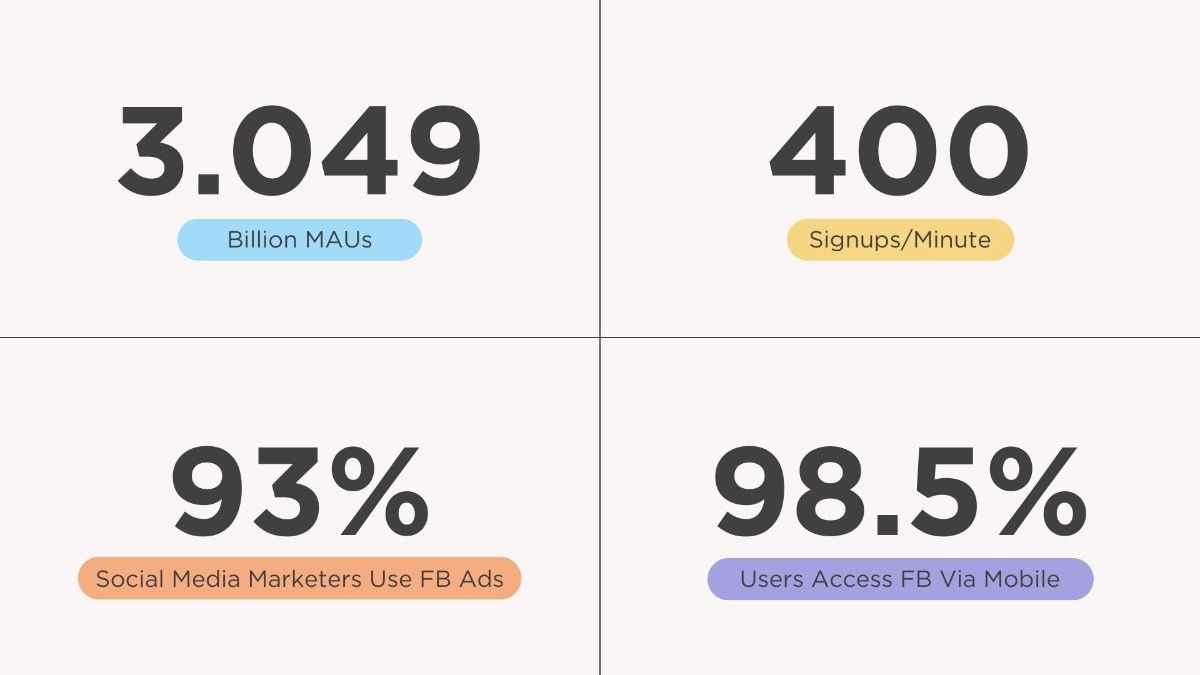
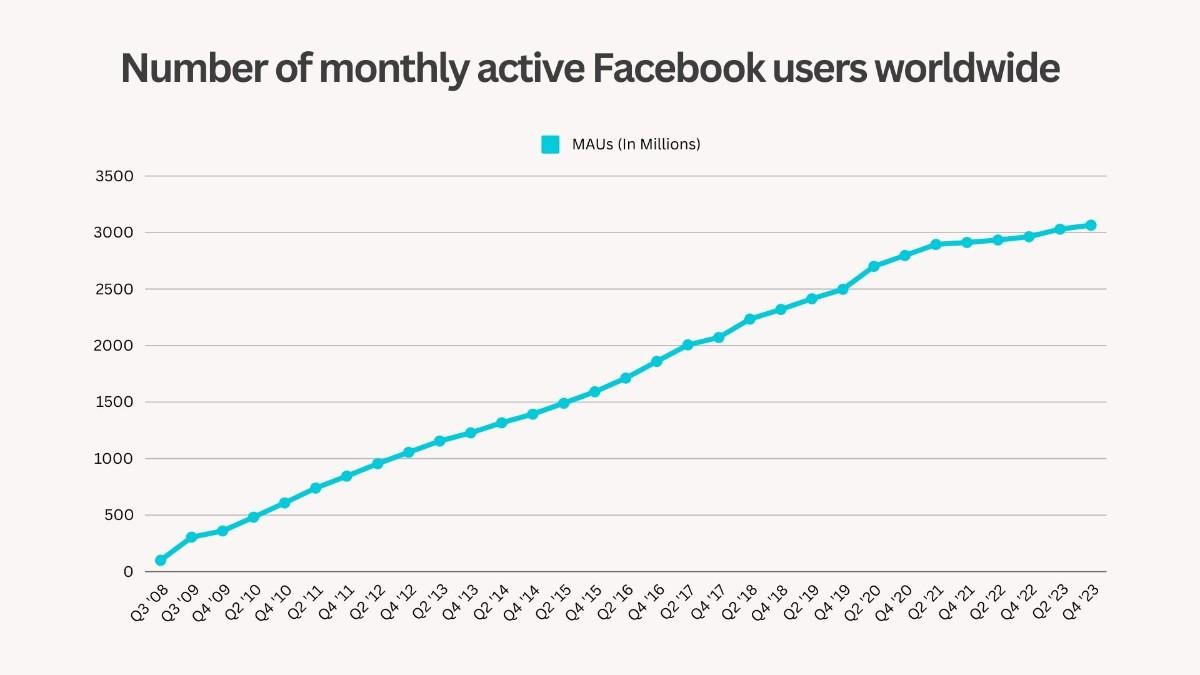
- Facebook, with over 3 billion monthly active users is the largest social media platform globally (Statista).
- Facebook’s monthly active users have risen by 7.18% year-over-year.
- When it comes to daily active users, this leading social media giant boasts a 2.09 billion user base (Statista).
- There is a 5.09% increase in daily active users year-over-year.
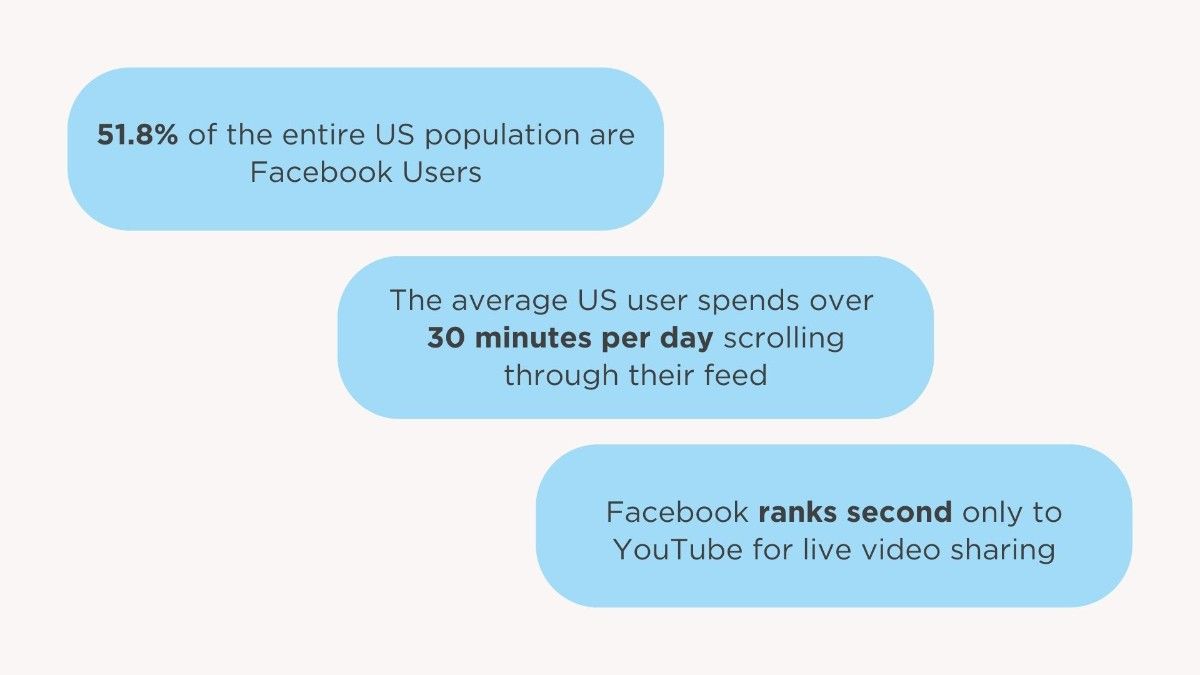
- Over 57% of global internet users engage with Facebook monthly.
- Nearly all users (98.3%) access Facebook through mobile devices (DataReportal).
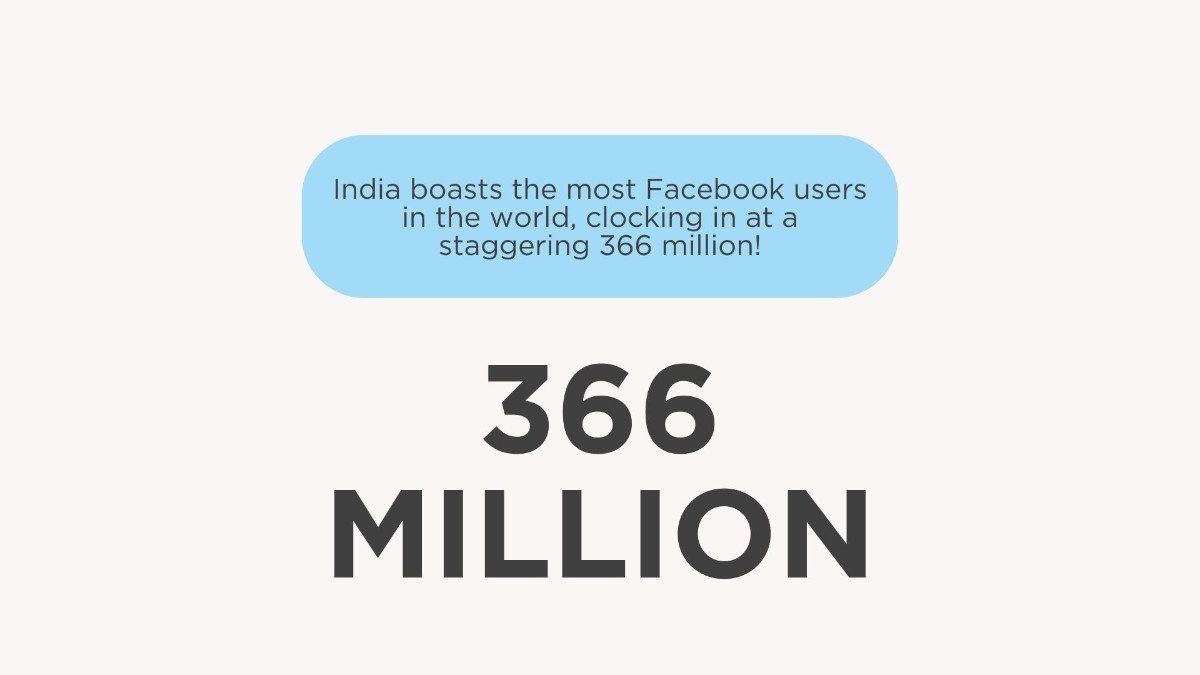
- India boasts the highest number of Facebook users (366 million), followed by the US, Indonesia, and Brazil, each with over 100 million users (Statista).
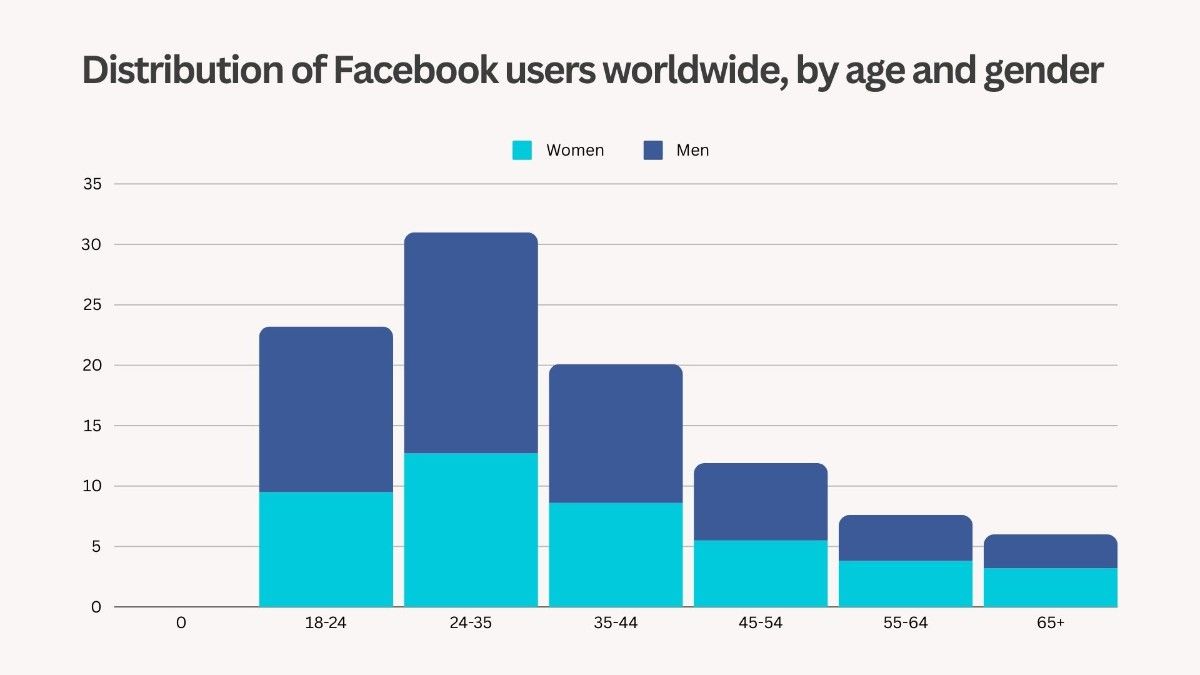
- Nearly 20% of Facebook’s global users are men aged between 25 to 34 years, and approximately 13% are women of the same age group – (Statista).
- The second largest audience base is 18-24 years with 13.7% being men.
- Nearly 1 billion users rely on Facebook Messenger for communication (Meta).
Facebook Platform Integrity
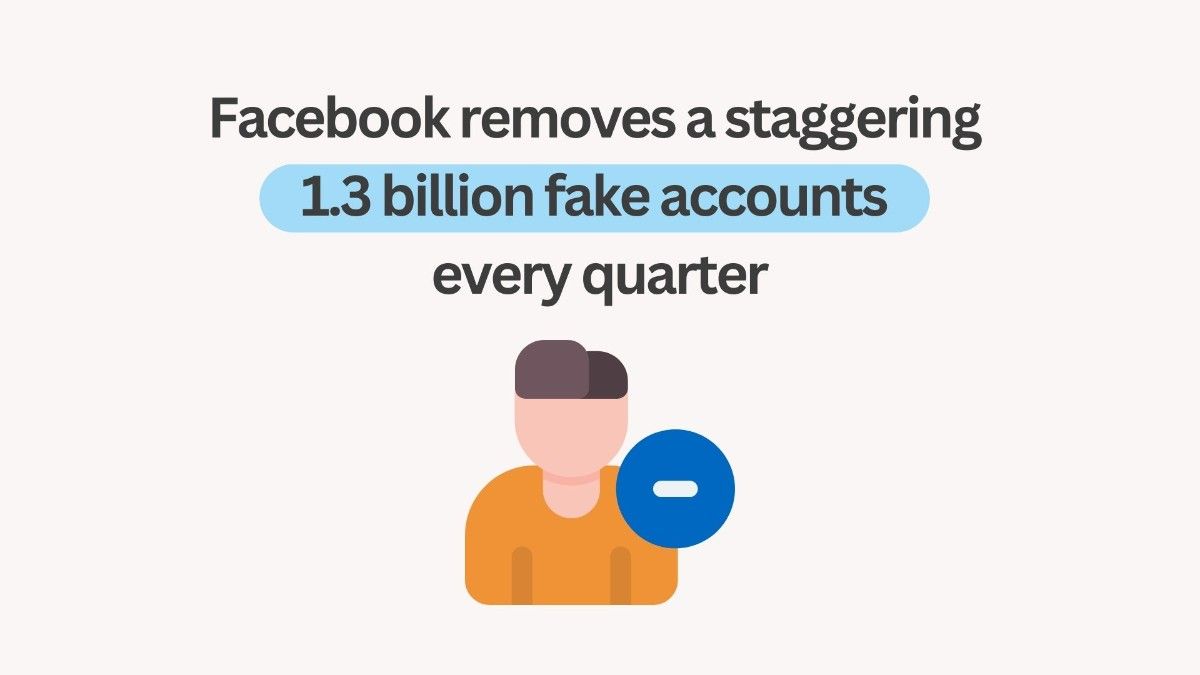
It’s evident that Facebook has actively been working on mitigating the issue of fake accounts on its platform over several years, with varying levels of activity and success. Let’s take a closer look at the trends and efforts involved in the last few years.
- First Quarter of 2019: Facebook removed a record number of approximately 2.2 billion fake profiles. This figure stands out as the highest reported in the time frames you’ve mentioned, indicating a peak period of activity in addressing account authenticity (Statista).
- Fourth Quarter of 2022: By the end of 2022, Facebook had removed 1.5 billion fake accounts. This still represents a significant number but is a substantial decrease from the peak in early 2019 (Statista).
- Fourth Quarter of 2023: There was a further reduction in the number of fake accounts removed, with 691 million fake accounts taken action upon. This is also a decrease from the previous quarter within the same year, where 827 million accounts were addressed.
The trend indicates a notable decrease in the number of fake accounts removed over the years from the peak in 2019. This could be due to a variety of factors:
- Improved Account Verification Processes: Facebook may have enhanced its methods for verifying new accounts, thereby reducing the number of fake accounts created in the first place.
- Deterrence through Policy Enforcement: Ongoing enforcement actions might deter bad actors from creating fake accounts at the same rate as before.
- Technological Advancements: Improved AI and machine learning algorithms could better identify and prevent the creation of fake accounts.
Facebook or Meta Platforms Employment Statistics
*Please note that Facebook Inc. was rebranded as Meta Platforms Inc. in 2021. The company is now commonly referred to as Meta.
- Employee Growth Over Time: The number of Meta Platforms employees grew from 77 in 2004 to 67,317 in 2023. This growth reflects the expansion and scaling of Meta’s operations and product offerings, from a university social network to a global tech giant with multiple platforms under its umbrella (Statista).
- Recent Decrease in Employees: There was a notable reduction in the number of employees from 86,482 in 2022 to 67,317 in 2023. This decrease of around 22% can be attributed to the broader tech industry trend where many companies, including Meta, have been restructuring and reducing their workforce in response to economic pressures and shifts in business strategy. (Statista).
- Tech Industry Layoffs in 2023: The tech industry saw significant layoffs in 2023, with over 262,000 employees laid off worldwide across more than a thousand companies. (Statista).
Facebook Historical Context and Growth Milestones
- Initial Expansion (2004-2006): Rapid growth as Facebook expanded from a university-based network to other institutions and eventually to the general public.
- Major Growth Phases (2007-2012): Employee numbers grew as Facebook introduced new features, expanded internationally, and built out infrastructure.
- Post-IPO Expansion (2012 onward): Continued growth post-IPO, with significant increases particularly noticeable around the years when Facebook was expanding into new technologies and acquiring companies like Instagram and WhatsApp.
- Diversity Challenges: Despite its growth, Meta has faced criticism regarding employee diversity. The majority of tech and management roles have been occupied by men, and the racial composition has been predominantly White. This has sparked discussions and pressure to improve diversity and inclusion within the company.
Facebook/Meta Economic Impact and Success
- Revenue and Profitability: By 2020, the company reported nearly $86 billion in revenue and a net income of $29.15 billion, highlighting its economic impact and success in the tech sector.
- Meta has announced that over ten million businesses worldwide utilize its advertising platform, which supports over $360 billion in global economic activity. (EconomicsObservatory).
- User Base: Facebook remains the most popular social network globally, with significant user engagement and reach. It continues to drive its business model primarily based on advertising revenue.
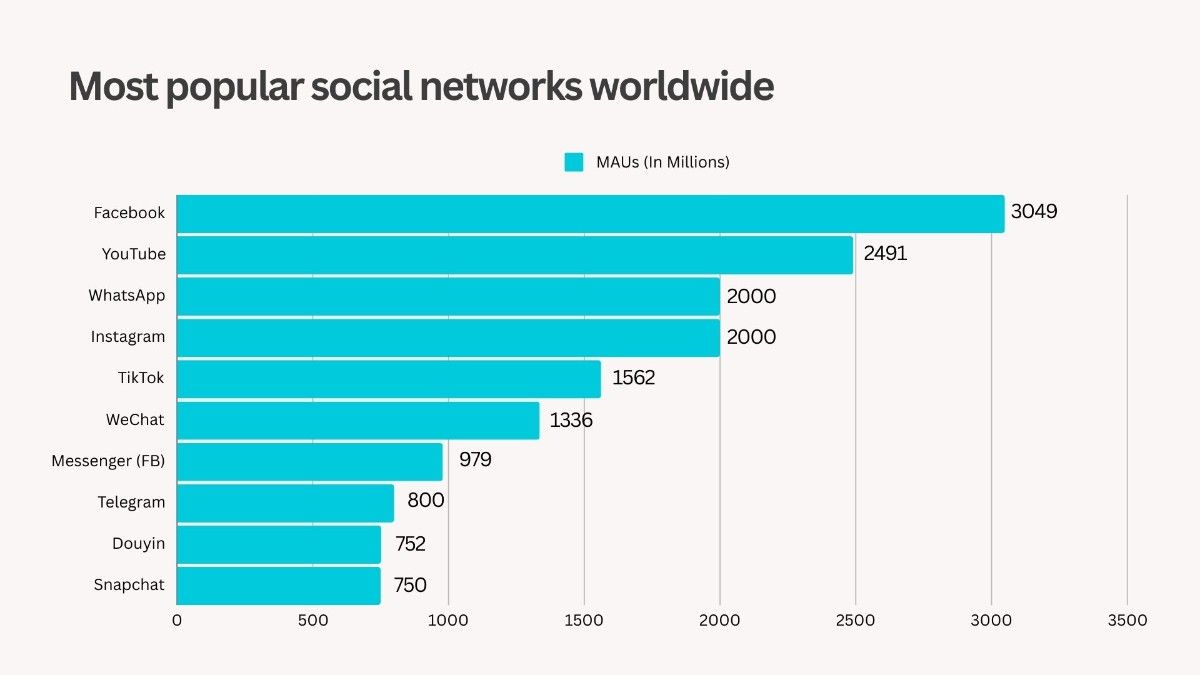
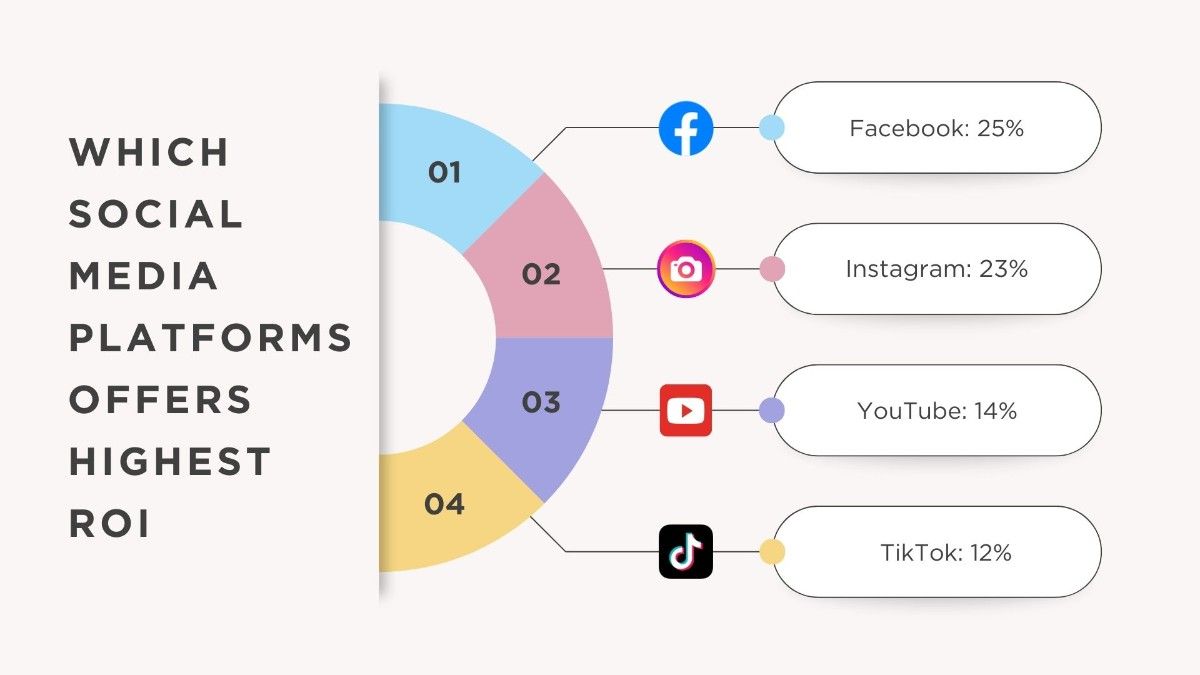
Top Global Social Networking Platforms
Leading the global social networking scene is Facebook with 3 billion monthly active users, closely followed by YouTube. Below are the other platforms that are leading the race in this category.
Facebook Usage and Engagement Statistics
What is the best time to post on Facebook?
- General Trends:
- Weekdays: Engagement is generally higher on weekdays (Monday-Friday) compared to weekends.
- Mid-mornings: The window between 9 am and noon seems to be a sweet spot across several studies.
- Fridays: Fridays, particularly around 10 am, often see a peak in engagement.
- Specifics:
- Sprout Social: Wednesdays and Thursdays between 9 am and 3 pm, with another potential spike at 5 pm on Wednesdays.
- Buffer: Fridays at 10 am with Mondays and Tuesdays at 10 am also ranking high.
- Around 98.5% of people access Facebook using their mobile devices.
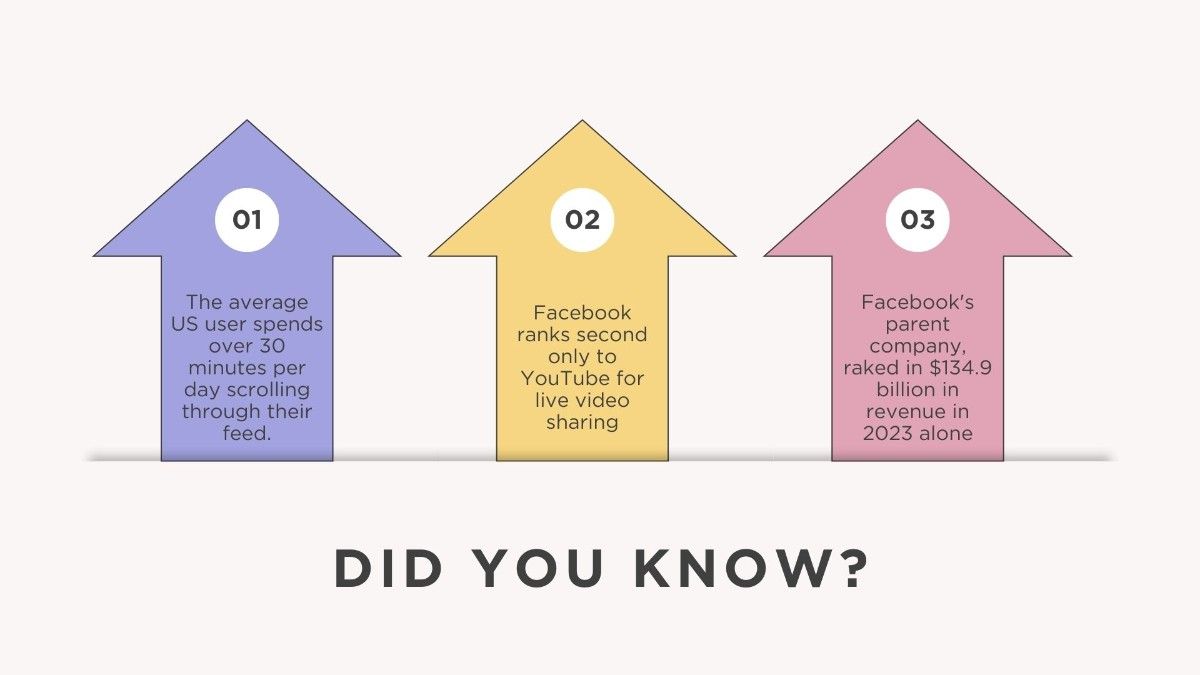
- Users spend about 30.9 minutes (average) on Facebook each day (Backlinko).

Facebook User Behavior and Social Dynamics
- Over 1.4 billion people use Facebook Groups every month, with more than 10 million groups active on the platform (Convosight)
- There are an average of 5 billion comments made and 30 billion pieces of content shared on Facebook each month (Kinsta).
- Facebook processes around 1.5 billion searches per day, with users actively seeking specific content or profiles. It was 2 billion searches per day in 2016 (TechCrunch).
Facebook User Dislikes:
- Oversharing Concerns: Users dislike oversharing by friends and the unauthorized posting of personal information, especially photos.
- Parental Concerns: 57% of Facebook users with children under 18 strongly dislike others posting pictures of their children without permission.
- Limited FOMO Impact: Only 5% of users strongly dislike seeing others engage in activities they were not part of; 84% are not bothered by this.
Reasons for Using Facebook:
- Content Appreciation: 47% of users value photos and videos from friends as a major reason for using Facebook.
- Sharing and Communication: 46% cite the ability to share with many people simultaneously as a key reason.
- Updates and Humor: 39% use Facebook for updates from others and humorous content.
- Gender Variance: Men and women sometimes differ in their reasons for using the platform.
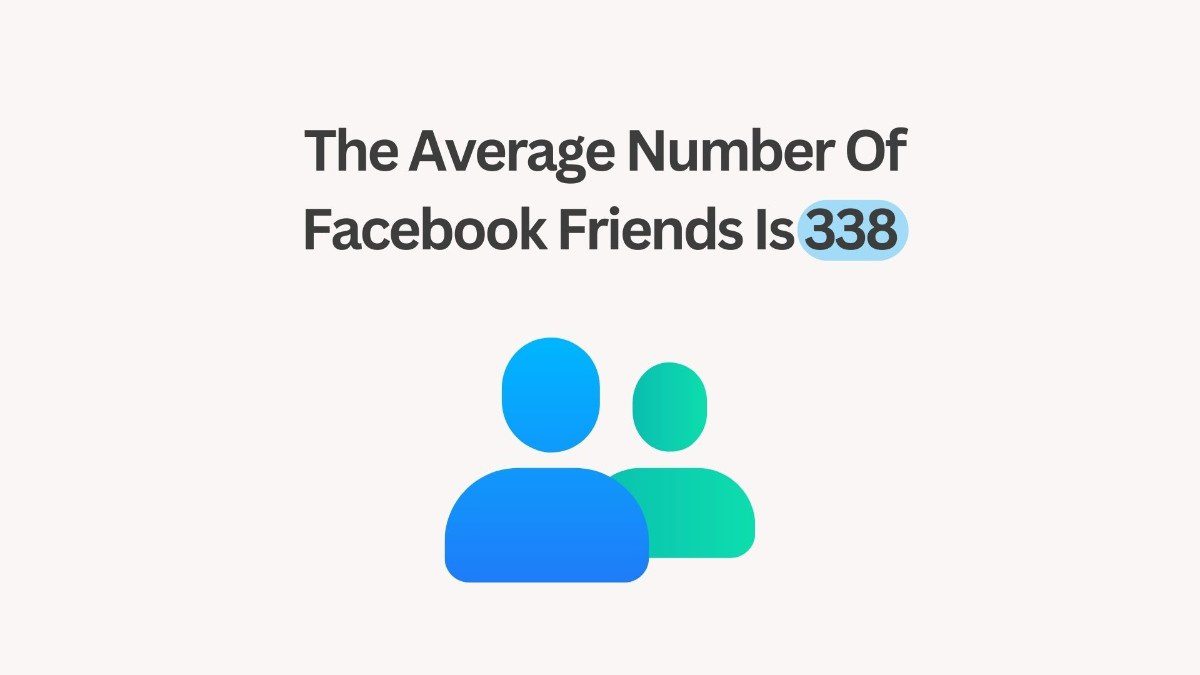
Facebook Friend Networks:
- Friend Counts:
- 39% of adult users have 1-100 Facebook friends.
- 23% have 101-250 friends.
- 20% have 251-500 friends.
- 15% have more than 500 friends.
- Average Friendships: The average number of friends is 338, with a median of 200.
- Age Differences: Younger users (18-29) tend to have larger networks, with 27% having more than 500 friends.
Friend Removal Requests:
- Incidence of Requests: 12% of users have been asked to “unfriend” someone.
- Age Factor: Requests are more common among younger users, with 19% of 18-29-year-olds experiencing this.
- Source of Requests: These requests often come from other friends (35%) or current/former romantic partners.
Liking and Commenting:
- 44% of users “like” content at least once a day; 29% do so several times per day.
- 31% comment on photos daily; 15% do so multiple times per day.
- Private Messaging: 19% send messages daily, with 10% sending multiple messages per day.
- Status Updates: 10% update their status daily, but 25% never update their status.
Exposure Among Non-Users:
- Household Facebook Use: 52% of non-users live with someone who has a Facebook account.
- Indirect Usage: 24% of non-users who live with an account holder occasionally view photos or posts on the account.
Source: A Survey & Report by PEW RESEARCH CENTER
Facebook Users By Country
An overview of the countries with the largest Facebook user bases measured in millions as of January 2024:

- Top countries with the most Facebook users:
- India: 85 million users
- United States: 190.85 million users
- Indonesia: 117.6 million users
- Brazil: 111.25 million users
- Mexico: 90.2 million users
- Philippines: 86.75 million users
- Vietnam: 72.7 million users
- Bangladesh: 52.9 million users
- Thailand: 49.1 million users
- Egypt: 45.4 million users
- Pakistan: 44.5 million users
- United Kingdom: 37.1 million users
- Nigeria: 36.75 million users
- Colombia: 36.7 million users
- Turkey: 34.35 million users
- France: 29.95 million users
- Argentina: 28.75 million users
- Italy: 26.1 million users
- South Africa: 26 million users
- Algeria: 24.85 million users
Source: Statista
Analysis of Facebook’s Global User Base By Country
- Asia Dominance: India, Indonesia, and the Philippines feature prominently, indicating that Asia remains a crucial market for Facebook with the largest combined user base. India alone constitutes about 20% of Facebook’s global audience.
- Strong Presence in Developing Markets: Countries like Vietnam, Bangladesh, and Egypt also make the list, showcasing Facebook’s significant penetration in developing regions. This may be attributed to the increasing internet accessibility and mobile device proliferation in these areas.
- High Penetration in Developed Countries: The United States, as the second largest market, along with the United Kingdom and France, reflects Facebook’s sustained popularity in developed economies with high internet penetration rates.
- Latin America and Southeast Asia: Brazil, Mexico, Colombia, and Argentina represent Latin America, highlighting the platform’s strong foothold in this region. Southeast Asian countries like Thailand and Vietnam further underscore Facebook’s appeal in this digitally growing region.
- Middle Eastern and African Markets: Egypt, Nigeria, and South Africa’s presence in the list indicates Facebook’s effective reach and usage in parts of the Middle East and Africa, regions with growing digital landscapes.
- Comparative Analysis of Growth Potential: While developed countries show high user numbers, the growth rate is likely slower compared to developing countries where more users are coming online for the first time. This suggests potential for expansion in markets like Nigeria and Bangladesh.
- Potential for Targeted Marketing: The diverse geographical spread of Facebook’s audience presents opportunities for localized and targeted marketing strategies, especially in high-user base countries with unique cultural contexts.
Source: Statista
Facebook Stats For Businesses
Business Adoption and User Behavior:
- Local Focus: Over 70% of users visit local business pages weekly, emphasizing its importance for local businesses (SocialPilot)
- Widespread Adoption: Over 200 million businesses utilize Facebook and its sister apps for customer engagement (Hootsuite Blog).
- Strong Presence: 91% of organizations in the world have a Facebook presence, indicating its dominance in social media marketing.
- Messaging Impact: Businesses reachable via Facebook Messenger see a 53% increase in shopping likelihood.
- Mobile Essential: With over 80% accessing Facebook via mobile, mobile optimization is crucial (Hootsuite Blog).
Content and Engagement:
- Content Strategy: Brands typically post 5 times per week, necessitating consistent content planning.
- Engagement Challenge: Facebook page engagement rates average less than 1%, requiring innovative strategies.
- Visual Appeal: Image posts garner the highest engagement, highlighting the importance of visuals.
- Storytelling Value: Half of users take action after seeing a brand’s Facebook story, showcasing its potential.
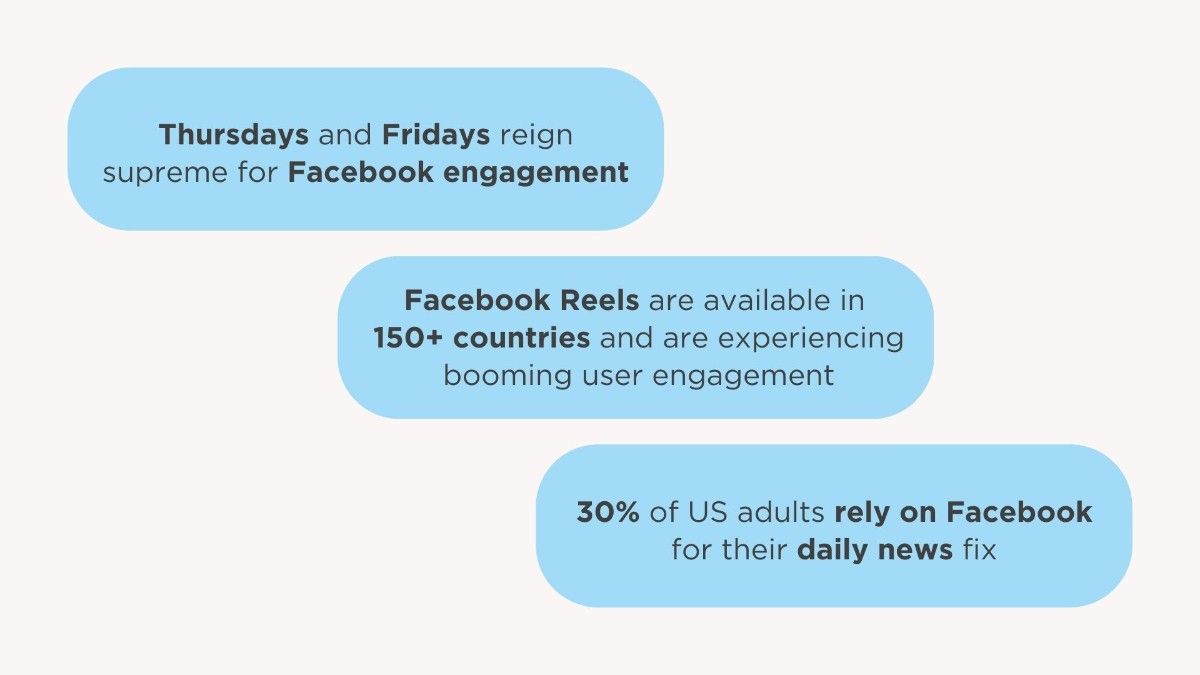
- Reels’ Impact: Facebook Reels with audio see a 35% higher click-through rate, indicating their growing significance.
Facebook Ads and Marketing Statistics:
- Advertising Dominance: 93% of social media advertisers use Facebook Ads, showing its effectiveness.
- Messenger Marketing: With nearly 1 billion users, Facebook Messenger is valuable for targeted ad campaigns.
- Ad Optimization: Effective ad titles are around 4 words, and link descriptions should be about 15 words long.
- Visual Importance: Images drive 75-90% of Facebook Ad performance, emphasizing their significance.
- ROI: 26% of users who click on ads report making a purchase, showcasing Facebook’s sales-driving potential.
- E-commerce Integration: Facebook Shops boasts over 1 million monthly active users globally, offering businesses an integrated e-commerce solution.
Facebook Shopping Statistics
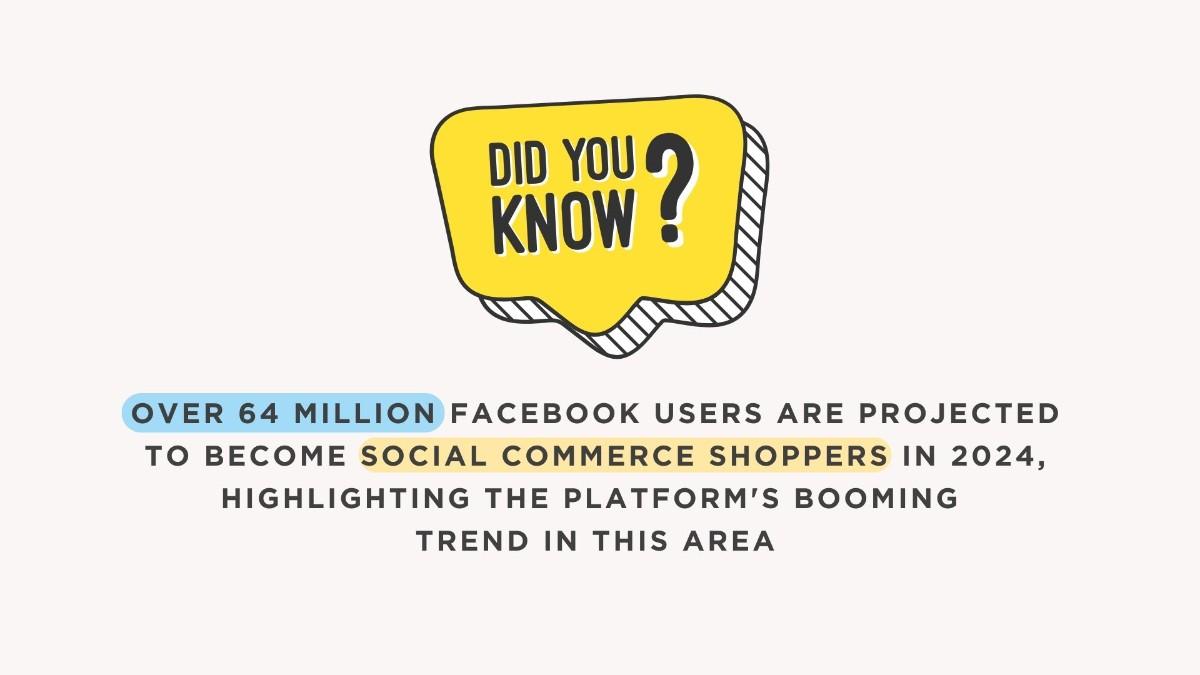
- Facebook has become a key player in online shopping, with over 64 million consumers in the US expected to shop on the platform in 2024.
- 19% of US shoppers start product searches on Facebook, highlighting its role in purchase decisions.
- A significant 62% of US shoppers have already used Facebook for online shopping.
- Facebook leads in social commerce, with 63.5 million people making purchases through the platform. This includes activity on Facebook Marketplace, highlighting its importance in the social shopping scene.
- Facebook Marketplace boasts over 1 billion monthly active users, indicating strong engagement in buying and selling directly on the platform.
- Up to 40% of Facebook’s 3.07 billion monthly active users shop on Marketplace.
- An estimated 491 million, or 16% of active users, log in to Facebook solely for the purpose of shopping on Facebook Marketplace.
- Facebook Marketplace is available in 227 countries and territories worldwide.
- A significant 24% of Facebook users find clicking or tapping on ads enjoyable.
- Moreover, a substantial 65.9% of all social media users made their latest purchase through Facebook.
Facebook Reels Statistics
- Over 50% of time spent on Facebook is dedicated to video content, with Facebook Reels generating significant user engagement – (Facebook).
Reels Viewership and Engagement:
- Daily watch time for Reels across Facebook and Instagram is a staggering 200 billion views.
- Facebook Reels with sound have a 35% higher click-through rate than other video formats.
Facebook Reels and Advertising:
- Facebook Reels ads offer a potential reach of 697.1 million users, though less than Stories ads.
- Reels ads are still a new frontier for advertisers, presenting an opportunity to stand out [Source: Hootsuite Blog].
- In 2022, Reels contributed to 3.3% of ad impressions on Facebook, but this share is plateauing [Source: Hootsuite Blog].
Facebook Stories Statistics
- Facebook Stories boasts 500 million daily users, highlighting the importance of short-form, ephemeral content – (Facebook).
91. More than 1 billion Stories are shared every day across the Meta apps – (Facebook).
- 73% of people in the U.S. feel that Facebook Stories allow them to experience new things outside their everyday lives.
- 65% of U.S. respondents believe that Stories help them feel closer to and more up-to-date with friends.
- 57% of people in the U.S. report that Stories make them feel part of a larger community.
- 62% of U.S. users intend to use Facebook Stories more frequently in the future than they currently do.
- Stories are optimized for a vertical, full-screen view, matching the way people typically hold their phones—vertically about 90% of the time.
Facebook Posts & Likes Engagement Stats
- The average Facebook post engagement rate is a low 0.063%, meaning for every 1,000 followers, only about 6-7 interact with a post [source: Sprout Social].
- Posts with images see 2.3 times more engagement than those without [source: Gitnux].
- Asking questions in your posts can boost comments by 100% [source: Gitnux].
- Organic reach (number of people seeing your post without paying) has been steadily declining for years on Facebook.
- Posts with a mix of visuals, questions, and informative content tend to perform best.
Images and Content Types:
- The most liked Facebook post (as of April 2024) is a picture of Vin Diesel with Paul Walker, with over 7.9 million likes [source: Gitnux].
- Over 250 billion photos have been uploaded to Facebook, with an average of 350 million added daily [source: Wishpond Blog].
- Link posts have the lowest engagement of any content type, averaging just a 0.03% interaction rate [source: Hootsuite Blog].
Likes and User Behavior:
- An estimated 500,000 likes occur on Facebook every minute [source: Gitnux].
- Likes are a basic metric, but true engagement involves comments, shares, and clicks.
- Over 80% of Facebook users access the platform on their phones, so optimize your content for mobile viewing [source: Hootsuite Blog].
Facebook vs. Other Platforms
- Facebook vs. Twitter: While Facebook engagement is low, it’s still higher than Twitter’s average engagement rate of 0.029% [source: Sprout Social].
- Teen Trends: Interestingly, teens from lower or middle-income families are more likely to use Facebook than those from wealthier backgrounds [source: Hootsuite Blog].
Here’s a comparison of Facebook with other social media platforms:
- User Base:
- Facebook: King of the social media hill with over 3 billion monthly active users [source: Sprout Social].
- YouTube: The video giant boasts over 2.5 billion monthly active users [source: Backlinko].
- WhatsApp: Focuses on private messaging but still holds a massive user base of over 2 billion monthly actives [source: Backlinko].
- Instagram: Facebook’s sibling platform attracts a younger demographic with over 1.4 billion monthly active users [source: Backlinko].
- Twitter: While influential, Twitter has a smaller user base of around 436 million monthly active users [source: Backlinko].
- Engagement:
- Facebook struggles with a low average engagement rate of 0.063% per post [source: Sprout Social].
- Instagram: Engagement is higher on Instagram, averaging around 0.89% per post [source: Later].
- Twitter: Similar to Facebook, Twitter has a low engagement rate of 0.029% per tweet [source: Sprout Social].
- Content Focus:
- Facebook: Mix of text, images, videos, and live streams.
- YouTube: Primarily focuses on video content.
- WhatsApp: Primarily used for private messaging and photo/video sharing.
- Instagram: Known for its focus on high-quality images and short-form videos (Reels).
- Twitter: Text-based platform with a 280-character limit per tweet.
- Advertising:
- Facebook: Still dominates social media advertising with a massive reach and advanced targeting options.
- Instagram: Offers strong advertising options for reaching a younger demographic.
- YouTube: A dominant platform for video advertising.
- Twitter: Advertising reach is smaller than Facebook and Instagram, but can be effective for reaching specific demographics and interests.
Leading Traffic Referrers to Facebook.com Worldwide
- What are the top traffic referrers to Facebook?
Here’s a breakdown of the top external and internal sources directing traffic to Facebook as measured in December 2023:
- com: 6.75% of traffic
- com: 4.49% of traffic
- Spotify.com: 3.97% of traffic
- ee: 2.8% of traffic
- com: 2.16% of traffic
Source: Statista
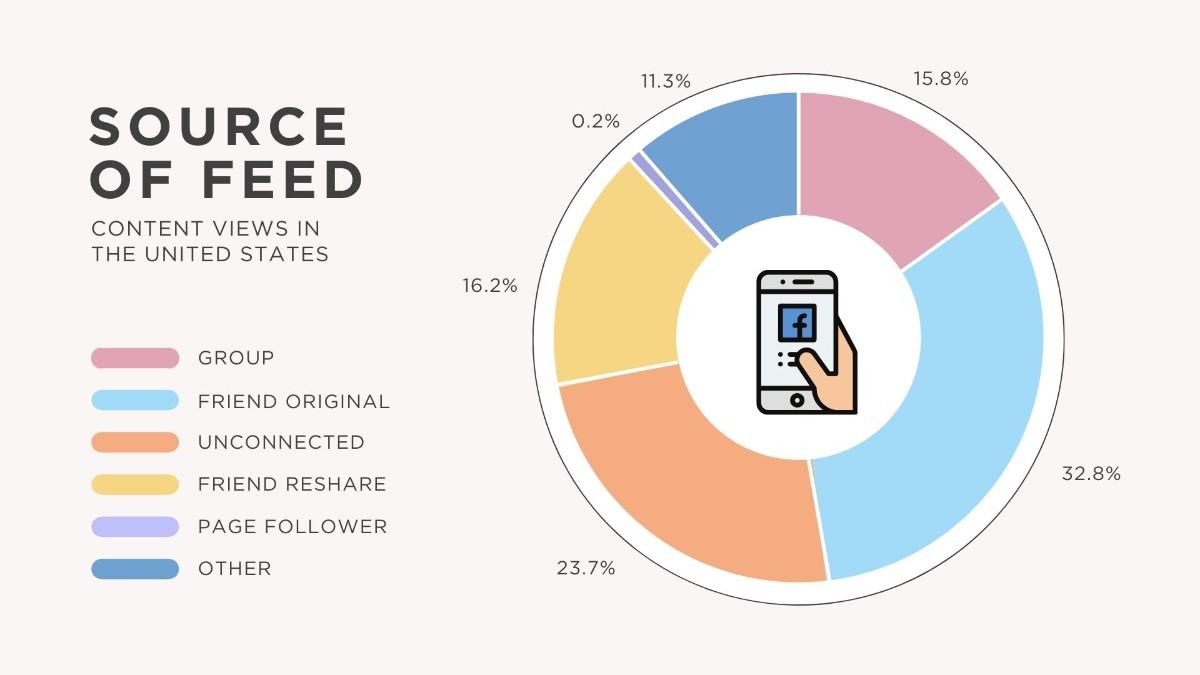
Facebook News Feed Stats and Findings
- Around 80% of the content users see in their Facebook news feed comes from friends, family, and groups they’ve joined [Source: Pew Research Center, 2022].
- News articles make up a relatively small portion of Facebook news feeds, estimated to be around 4%. This suggests that users primarily rely on Facebook for social interaction rather than in-depth news consumption.
Facebook Revenue Stats and Data
Revenue:
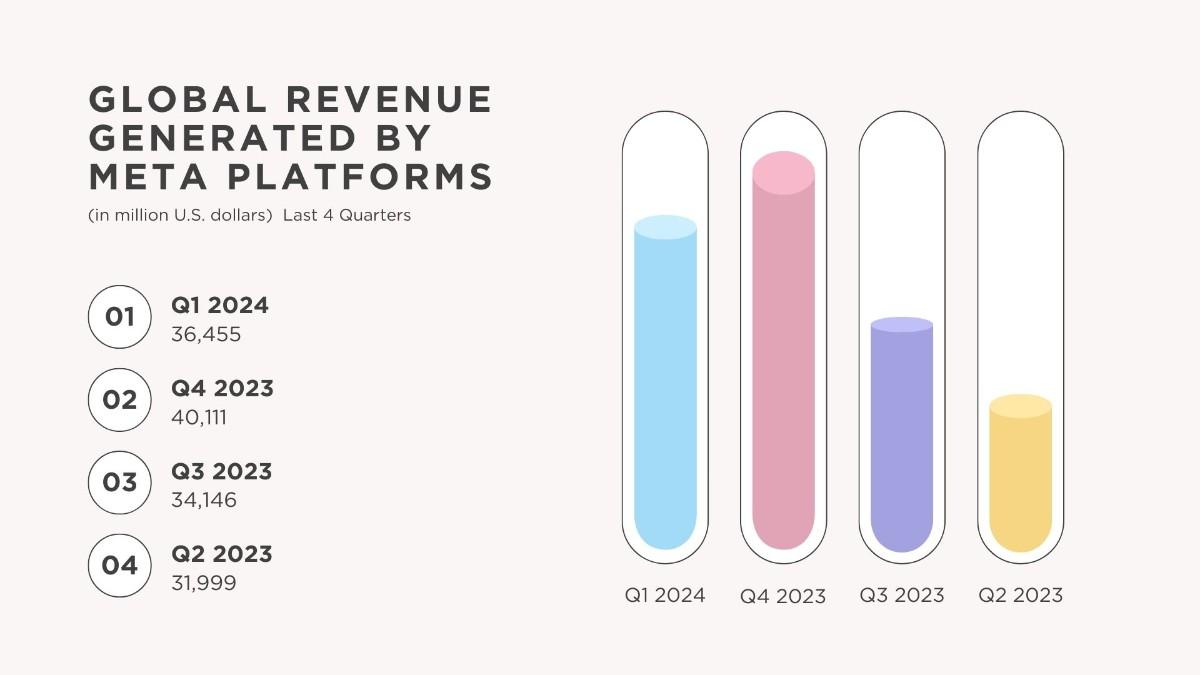
- Meta, Facebook’s parent company, generated $134.9 billion in total revenue in 2023.
- Facebook itself contributed roughly $71 billion to that total.
Ad Revenue:
- Advertising makes up over 97.5% of Facebook’s revenue.
- In 2023, Facebook’s ad revenue reached $131.95 billion.
- Mobile ads are particularly dominant, generating around 94% of Facebook’s ad revenue.
Facebook Ad Revenue: Forecast 2025–2026
| Year | Facebook Ad Revenue Forecast (in Billions) |
| 2025 | $187.35 |
| 2026 | $202.94 |
ARPU & Growth
- The average revenue per user (ARPU) globally sits at $13.12, with a significant jump to $68.44 for users in the US and Canada.
- Facebook’s ad revenue has grown steadily, with an average annual increase of 23.5% from 2017 to 2024.
Facebook’s Top Followers: A Breakdown by Category
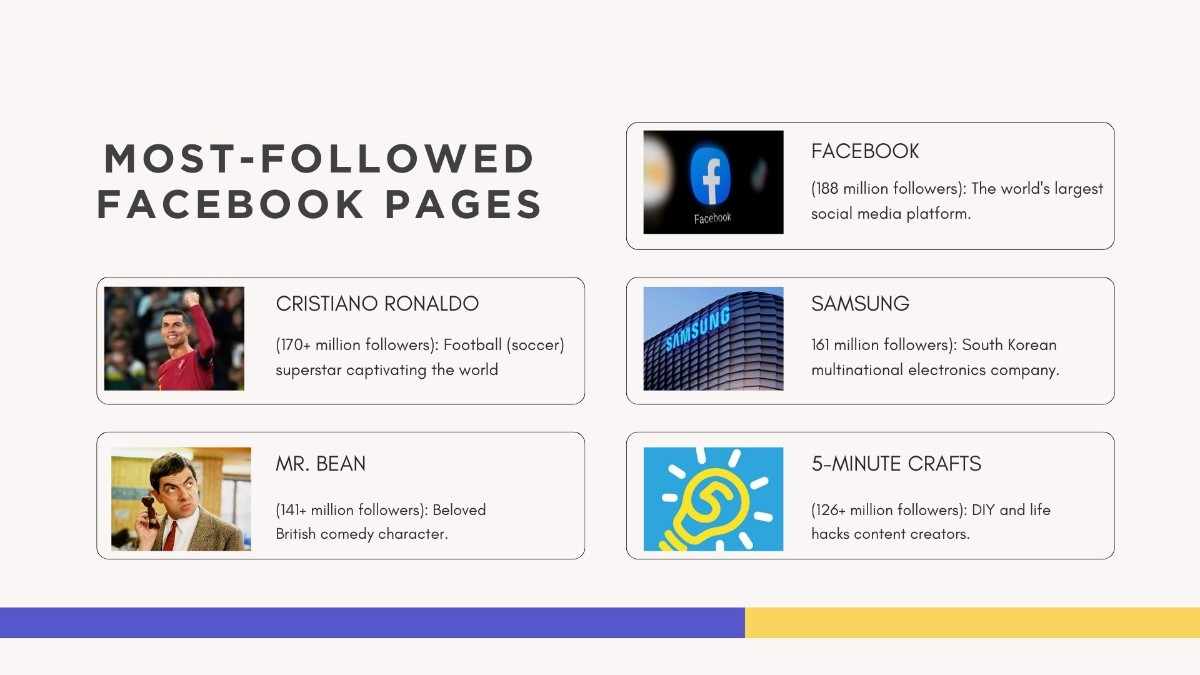
- Brands: Many of the most-followed pages are for global brands like Samsung, Coca-Cola, and companies like 5-Minute Crafts.
- Celebrities: Athletes like Cristiano Ronaldo and Messi, singers like Shakira and Rihanna, and actors like Will Smith all have massive followings.
- Media: News outlets (CGTN, China Daily, Xinhua News Agency) and entertainment platforms (Tasty) also rank highly.
- Fictional Characters: Even a fictional character like Mr. Bean has a huge following.
By Content Focus:
- Entertainment: Funny content (Mr. Bean), music (Shakira), and short-form recipe videos (Tasty) are all popular.
- Sports: Football clubs (Real Madrid, Barcelona) and individual players (Ronaldo, Messi) dominate here.
- News: State media outlets (CGTN, China Daily) and general news agencies (Xinhua) have a large audience.
Interesting Facts About Facebook
- Facebook wasn’t always the social media giant we know today. It began as a dorm-room project called Facemash, which compared student photos to determine who was the most attractive.
- The iconic “Like” button was almost named “Awesome” but was changed by Mark Zuckerberg in 2007.
- Facebook is available in multiple languages, with only half of its users primarily speaking English.
- Facebook’s Privacy Checkup tool lets you review who sees your posts and what apps have access to your data.
- Facebook has multiple message inboxes, including hidden message requests and a support inbox.
- Facebook has experimented with alternative reaction buttons besides “Like.” In 2016, a limited test included “Dislike” but the feature was never fully implemented due to concerns about negativity on the platform.
Facebook Trends In 2024 And Beyond
- Deeper focus on privacy and security: Facebook has been working on improving privacy controls and security features. This will likely continue as user trust remains a top priority.
- Stronger communities: Facebook Groups are already a vibrant space for people with shared interests. We might see features that make it easier to discover and connect with relevant communities.
- The rise of Virtual Reality (VR): Meta, Facebook’s parent company, is heavily invested in VR. Facebook integration with VR could lead to immersive experiences and new ways to connect.
- AI-powered experiences: AI is already being used for content creation and recommendation. We might see more personalized content feeds, automated ad targeting, and possibly even AI-powered chatbots for customer service.
- The evolution of influencers: Influencer marketing will likely continue but with a shift towards micro-influencers with smaller, more engaged followings. Authenticity is key, so user-generated content that promotes products and services organically could become more prominent.
Frequently Asked Questions
Mark Zuckerberg, co-founder and CEO of Meta Platforms Inc. (formerly Facebook), holds approximately 13.6% of the company’s Class A common stock. It’s important to note that Meta also issues Class B shares with superior voting rights, which Zuckerberg holds as well. This structure grants him significant control over the company despite not owning a majority of the total shares.
Meta utilizes a geographically distributed network of data centers to store user information. The specific locations of these facilities are not publicly disclosed for security reasons. However, Meta adheres to strict data privacy regulations and provides transparency regarding its data storage practices in its publicly available reports.
While Facebook boasts a significant user base worldwide, its popularity varies geographically. As of today, India leads in terms of total monthly active users, followed by several countries in North and South America, Southeast Asia, and Africa. You can find more detailed user demographics through Meta’s publicly available data.
Conclusion
Facebook remains a social media giant, boasting billions of users and continued growth, especially in developing regions. While engagement rates might be lower compared to some platforms, Facebook offers a unique way to connect with a massive audience.
We hope you found these Facebook statistics helpful! Did anything surprise you? Let us know in the comments below!